How we run these studies
Every study on this site is a backtest you can reproduce in OptionKrafter. This page states the assumptions once — what the engine does, what the data covers, and where the numbers stop being trustworthy — so each article doesn't have to.
Engine rev 4 (Aug 2026): windows starting Apr 2023 evaluate minute by minute. Rev 5 (Sep 2026): in minute-by-minute runs, exit rules are evaluated only once the entry legs have filled.
What a study is
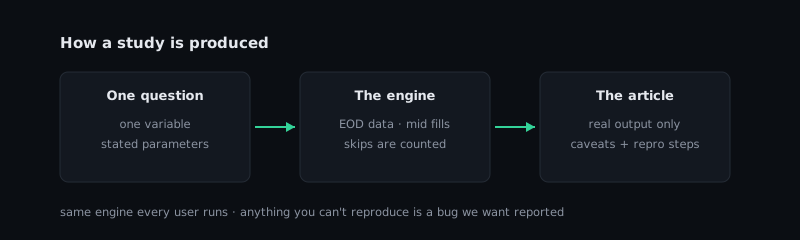
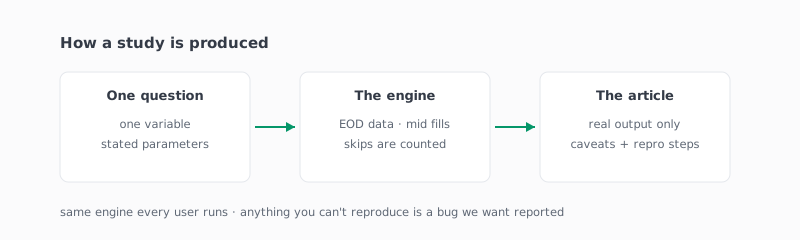
A study is a set of backtests run in the OptionKrafter engine — the same engine every user runs — with one question and, wherever possible, one variable. We publish the exact parameters with every article, so any result can be reproduced by building the same strategy and running it over the same window. If you can't reproduce a number we published, that's a bug report we want.
We don't publish predictions, signals, or trade ideas. A study describes what a rule set did over a stretch of history, stated in the past tense, with the caveats that bound it.
How the engine trades
- Data: two eras, one engine. End-of-day option chains from 2008 through March 2023, and 1-minute option trade bars from April 2023 onward, plus full daily OHLC (open, high, low, close) for every underlying, as-traded. In end-of-day evaluation, entries, exits, and option-priced rules are evaluated on daily closes, and the underlying’s daily high and low drive the iron breach rules; in minute-by-minute evaluation (windows starting April 2023 or later — engine rev 4, detailed in the resolution section below) the same rules evaluate on the minute they first trigger.
- Fills (engine rev 3; rev 4 extends the same model to minute fills — see the resolution section): each option leg fills a fraction of the way across that day’s closing bid/ask spread — buys at bid + spread × slip, sells at ask − spread × slip — a convention published and used across the options-backtesting industry. The default fraction scales with leg count, because multi-leg packages are quoted tighter than the sum of their legs; the exact ladder is in the table below. Every run reports two numbers: realistic (slipped fills — the headline in every study) and optimistic (the same trades at the pure mid, the model this site used before Aug 2026). Commissions default to $0 and are stated on every run. On the rare day a contract has no two-sided closing quote — all of 2008–2010, a shrinking share afterward — the leg fills at the last trade, is never slipped against a spread it lacks, and is counted in the run’s fill summary.
- Exit triggers fill at their threshold: a profit-target exit fills no better than the target level (an end-of-day price beyond it used to flatter the exit), and a stop exit keeps the adverse end-of-day value. Iron condor breach rules test the day’s intraday high and low per side — the one place the rules reference the underlying, whose range is in the data; option-priced rules remain end-of-day, and every run carrying one says so.
- Underlying prices: as-traded (unadjusted), so strikes, premiums, and moneyness compare correctly on every historical date. Positions held across a stock split are adjusted the way the OCC adjusts real contracts — strike divided by the ratio, contract count multiplied, share basis divided — so a split is a bookkeeping event, never a profit or loss. Where the vendor can't price an adjusted contract, its daily mark is interpolated between the two adjacent listed strikes (real same-day prices, never a model); trades carry their contract count when a split multiplied them.
- One position at a time unless an article says otherwise. When a position is open, entry days are skipped and counted — trade counts across arms of a study differ for this reason, and articles show per-trade averages alongside totals.
- Strike selection: percent-OTM, dollar offset, or delta targeting. Delta targeting picks the nearest listed strike, so the achieved delta differs from the target; trade records carry what was actually got.
The fill model at a glance
| Parameter | Value |
|---|---|
| Resolution — Apr 2023 onward | 1 minute |
| Resolution — 2008 to Mar 2023 | end of day |
| Buy-leg fill | bid + (ask − bid) × slip |
| Sell-leg fill | ask − (ask − bid) × slip |
| Default slip, 1-leg strategies (wheel, long call/put) | 0.75 |
| Default slip, 2-leg (vertical spreads, straddles, strangles) | 0.66 |
| Default slip, 3-leg | 0.56 |
| Default slip, 4-leg (iron condor, iron butterfly) | 0.53 |
| Slip configurable per strategy | Yes — 0.00 to 1.00 (0.50 = pure mid) |
| Applied | Per leg, per day, from that day’s closing quote — entry and market exits; expiry settlement uncharged |
| No print in qualifying minute | entry skipped |
| Commissions | Configurable per contract, default $0.00, charged per transacted leg-side |
| No two-sided quote (all of 2008–2010, partial 2011) | Leg fills at last trade, never slipped, counted on the run page |
| Underlying data | Full daily OHLC, as-traded (unadjusted); the day’s high/low drive iron breach rules |
| Underlying minute path — before mid-2025 | derived from underlying prints carried on option quotes |
| Ticker coverage | All US tickers with traded options |
| Wheel | full cycle simulated (assignment, share holding, covered calls, call-away), cost-basis floor optional |
| Wheel resolution | end of day (v1) |
| Profit-target exits | Fill no better than the target threshold |
| Stop exits | Keep the adverse end-of-day value |
| Results shown | Realistic (slipped + commissions, the headline) and optimistic (pure mid, reference only) — always both |
| Assumptions | Stamped on every run (slip, commission, engine revision, data snapshot) |
Defaults follow a convention published and used across the options-backtesting industry; the surrounding model — dual reporting, per-run stamping, threshold-clamped exits, counted fallbacks — is OptionKrafter’s own.
Bots evaluate and fill at a single live model price per leg — no spread is crossed and no commission is charged. Backtests apply a modeled spread and commissions, so a bot’s paper result is not directly comparable to a backtest of the same rules.
Resolution, and the two data eras
One engine, two data eras, and in each the finest resolution the data supports. Windows starting April 2023 or later evaluate minute by minute — automatically, on paid plans, with no setting to choose. Windows reaching earlier than that, and every wheel backtest (v1), evaluate end-of-day, exactly as described below. For the deep era — 2008 through March 2023 — the argument is unchanged:
OptionKrafter is an end-of-day engine, by design. Daily bars are what make eighteen years of option history tractable and every result reproducible; they match how rule-based options strategies are actually traded — entered and managed once a day, on rules, not on a screen watch; and they resist the curve-fitting that minute-by-minute noise invites. The resolution is part of the method, and every study states it.
The engine then extracts more from each trading day than a standard midpoint backtest even attempts: full daily OHLC on every underlying, so the day’s true high and low drive every rule that references the underlying’s price; closing bid/ask on every option; and spread-priced fills on every leg, with the realistic and the pure-mid figure printed on every run. Execution modeling — not tick resolution — is where a backtest earns or loses its credibility, and it is where this engine leads.
The minute era is an addition, not a correction. From April 2023 onward the data supports a finer resolution, so the engine uses it: entries, exits, stops, targets and breach rules evaluate minute by minute (engine rev 4), and every earlier result remains what it always said it was — end-of-day, stated on the run. What minute evaluation does and does not claim:
- A sparse print means the entry is skipped, not imagined. If no trade printed in the qualifying minute, the engine does not estimate a price — the entry is skipped and counted, like every other skipped entry.
- The underlying’s minute path before mid-2025 is derived from the underlying prints carried on option quotes — real observed prices, not a model — and from direct minute bars thereafter.
- A day with no minute observations falls back to end-of-day for that day, and the run page counts how many days did.
What the data covers
- Option chains begin January 2, 2008. No backtest reaches earlier, in studies or in the product.
- Market structure is real in the results. Weekly expirations barely existed before 2012, so early-era strategies trade sparsely compared with the modern era. That's the market, not missing data.
- Greeks and IV are end-of-day values from the data vendor. Legacy-era chains occasionally lack them; rules that need an unavailable value skip the day and say so rather than silently passing.
How to read the numbers
Three habits we apply to every article, and recommend for reading anyone's backtests:
- One underlying over one window is one sample. SPY from 2013 to 2025 spent most of its time in an uptrend; put-side premium selling looks better in that sample than it will in all futures. A result that only appears in one volatility regime is a description of that regime, not a rule about the strategy.
- Compare realistic to realistic. The band between a study’s realistic and optimistic columns is its execution cost — a number most published backtests hide by quoting the midpoint. When comparing our results to anyone else’s, check which fill model they quote before comparing at all.
- Trade counts matter as much as totals. Arms of a study that trade at different frequencies are exposed to different months. Net P/L rewards whichever arm happened to be in the market during the good stretches; per-trade averages reward whichever trades least. We show both.
- Survivable is not the same as good. High win rates with occasional deep losses are the signature of short premium. Max drawdown and the shape of the loss tail carry more information than the win rate, and we publish them.
What these numbers are not
Everything on this site is a hypothetical, simulated result on historical data. Nothing here is a record of actual trading, and past behavior does not indicate future behavior. Studies are educational analysis of what rules did; they are not investment advice, recommendations, or an offer to buy or sell any security. Options involve risk and are not suitable for all investors.