Option backtesting studies
Data studies across all US tickers: long-form backtests over years of history, with every result reproducible in the app. Every caveat stated. No signals, no predictions.
All
Methodology
Volatility
Earnings
Execution
Iron condors
0DTE
Assignment
Credit spreads
DTE
Data
Drawdowns
Entry filters
Event study
SPY
The wheel
Methodology
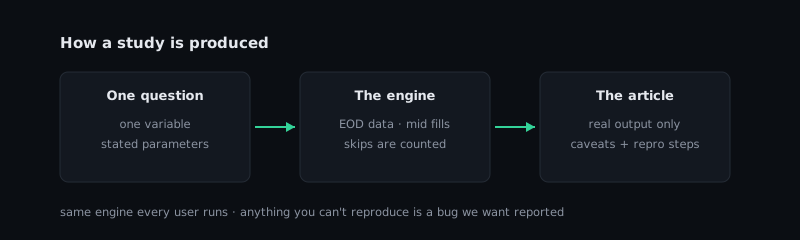
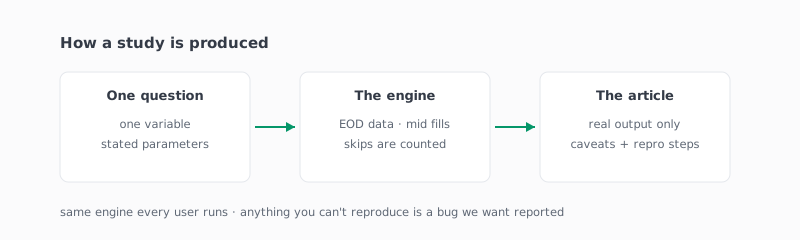
How we run these studies
Every study on this site is a backtest you can reproduce in OptionKrafter. This page states the assumptions once — what the engine does, what the data covers, and where the numbers stop being trustworthy — so each article doesn't have to.
The 0DTE iron condor: a 75% win rate that still loses money
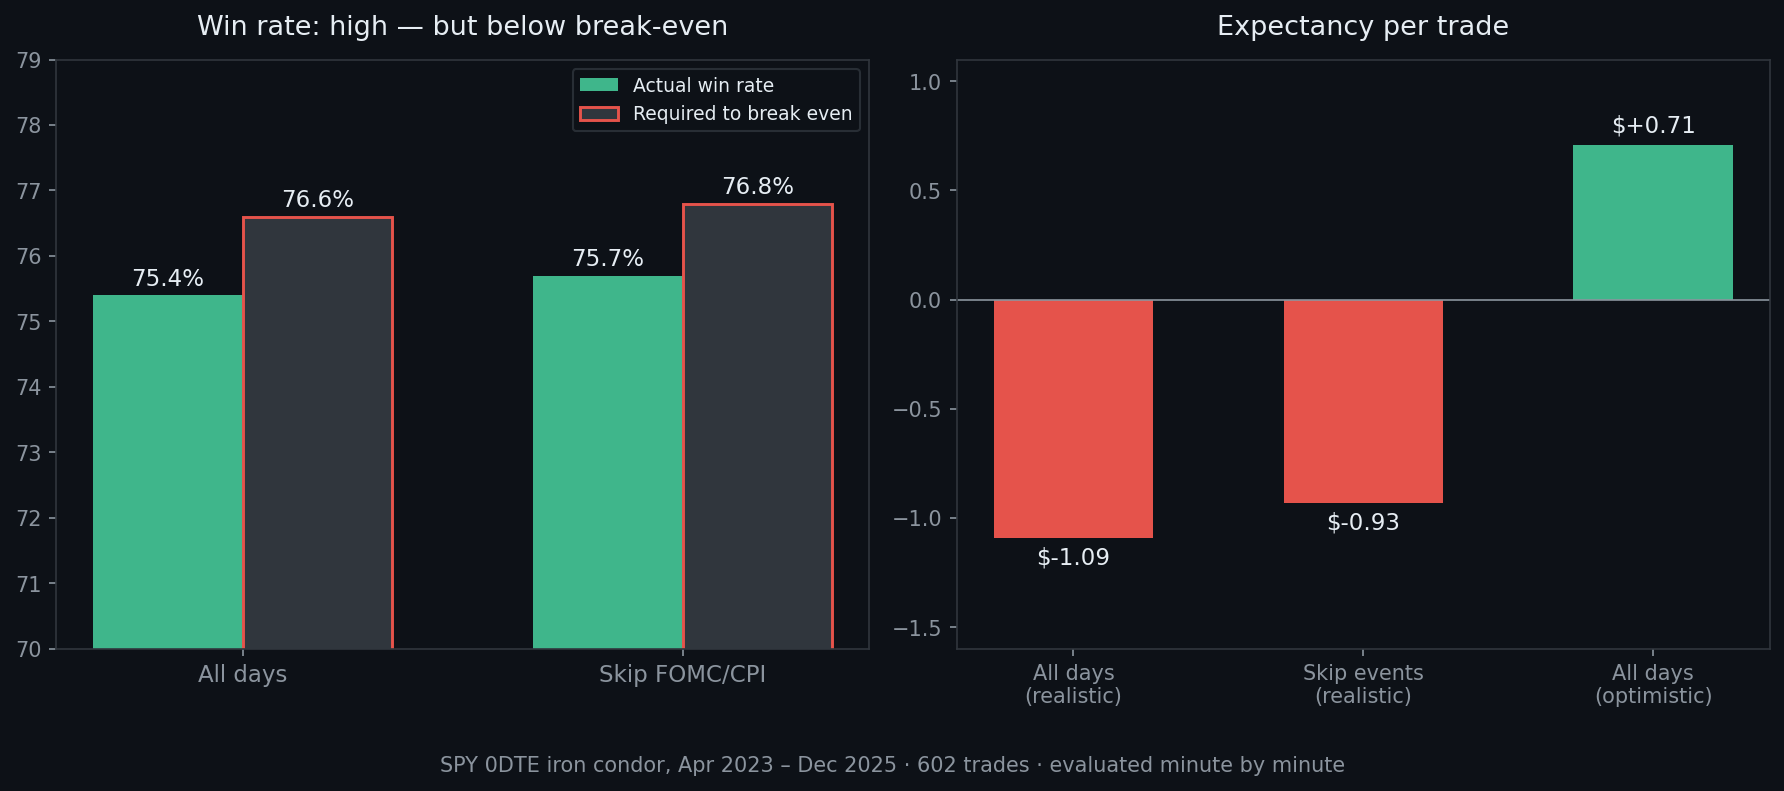
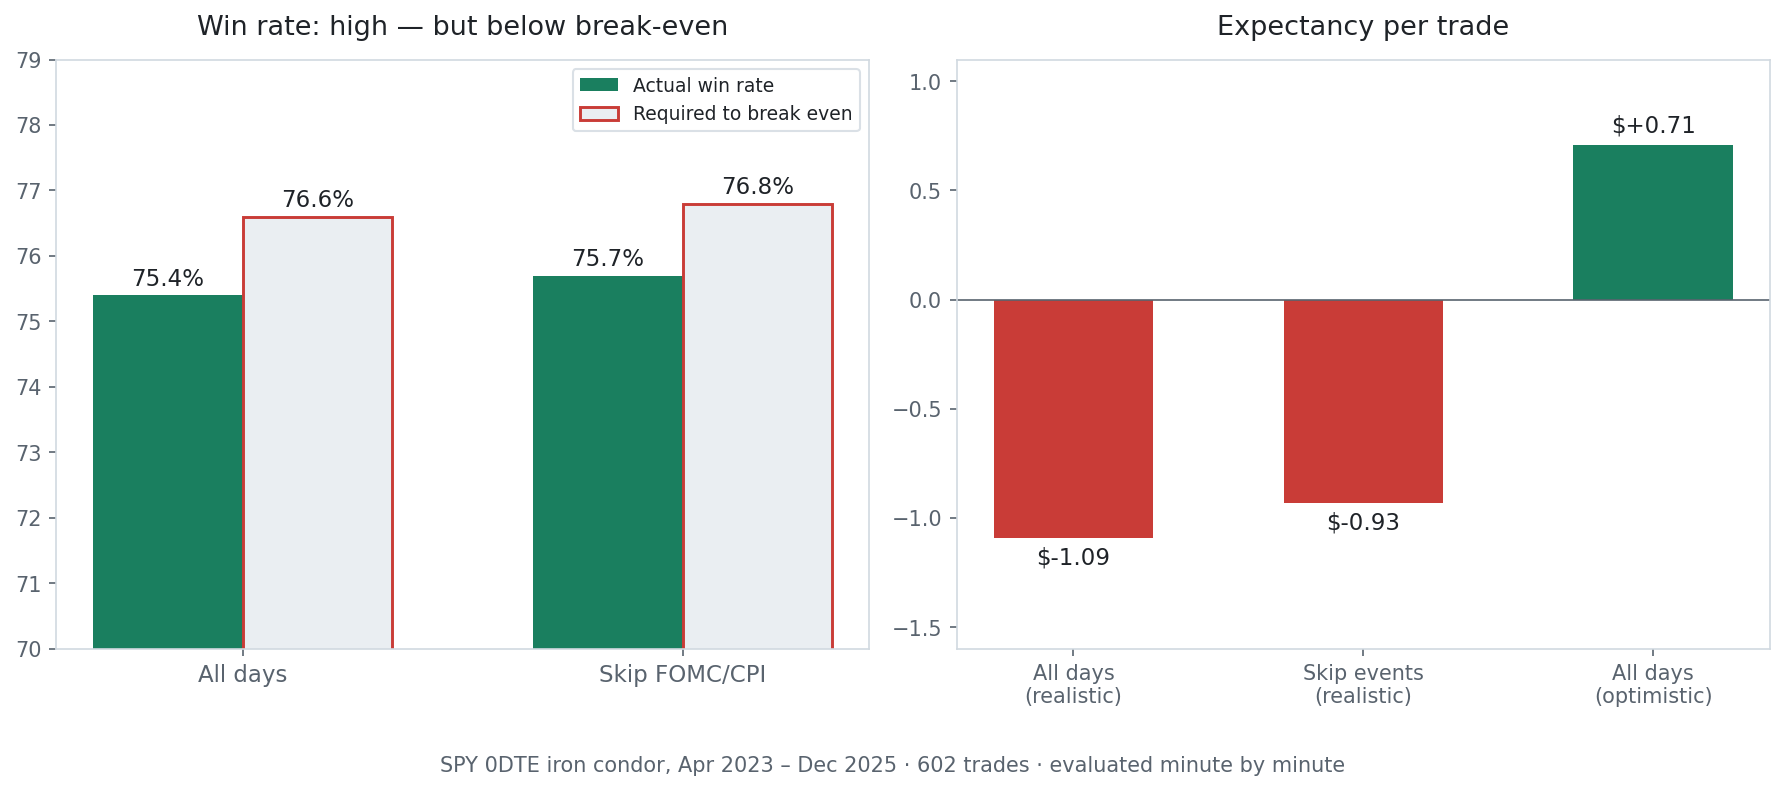
We ran the classic same-day SPY iron condor — 16-delta shorts, $5 wings, 10:00 ET entry — through every trading day from April 2023 to December 2025, minute by minute. It won three trades out of four and still lost money: the strategy needs a 76.6% win rate to break even and delivered 75.4%. At optimistic (pure mid) fills the same trades are profitable — the whole edge dies in the fills.
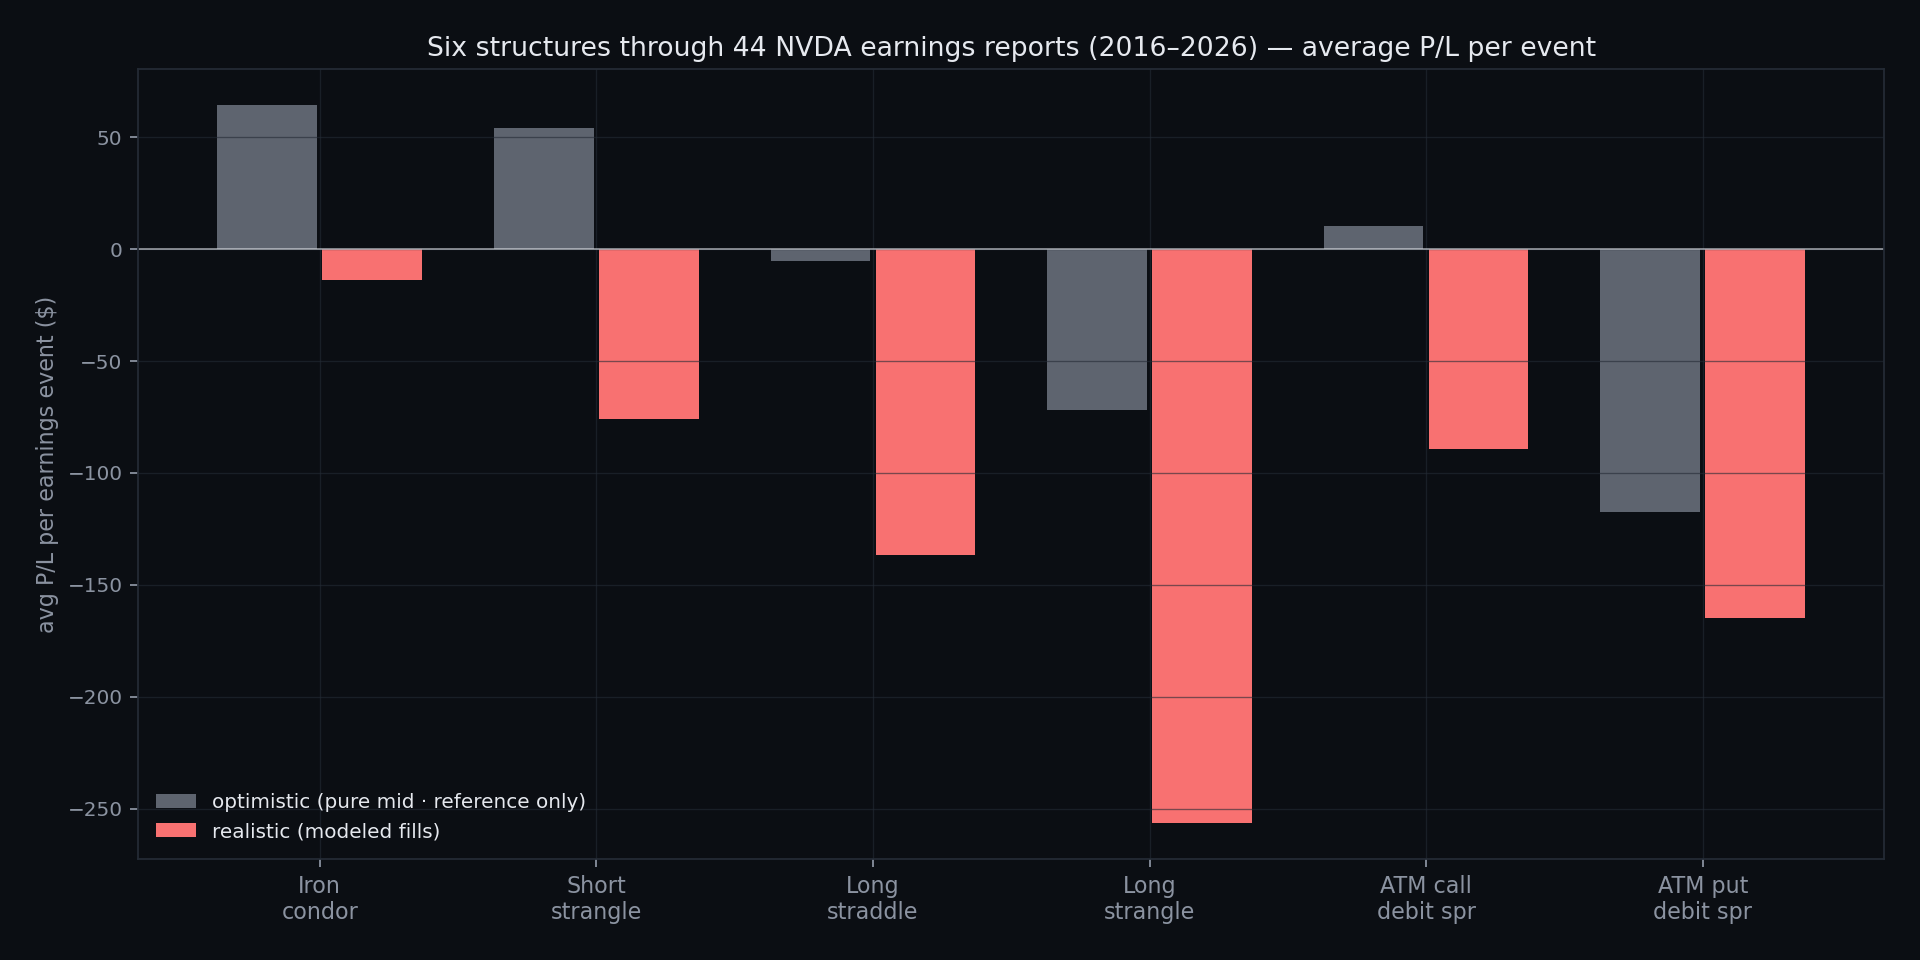
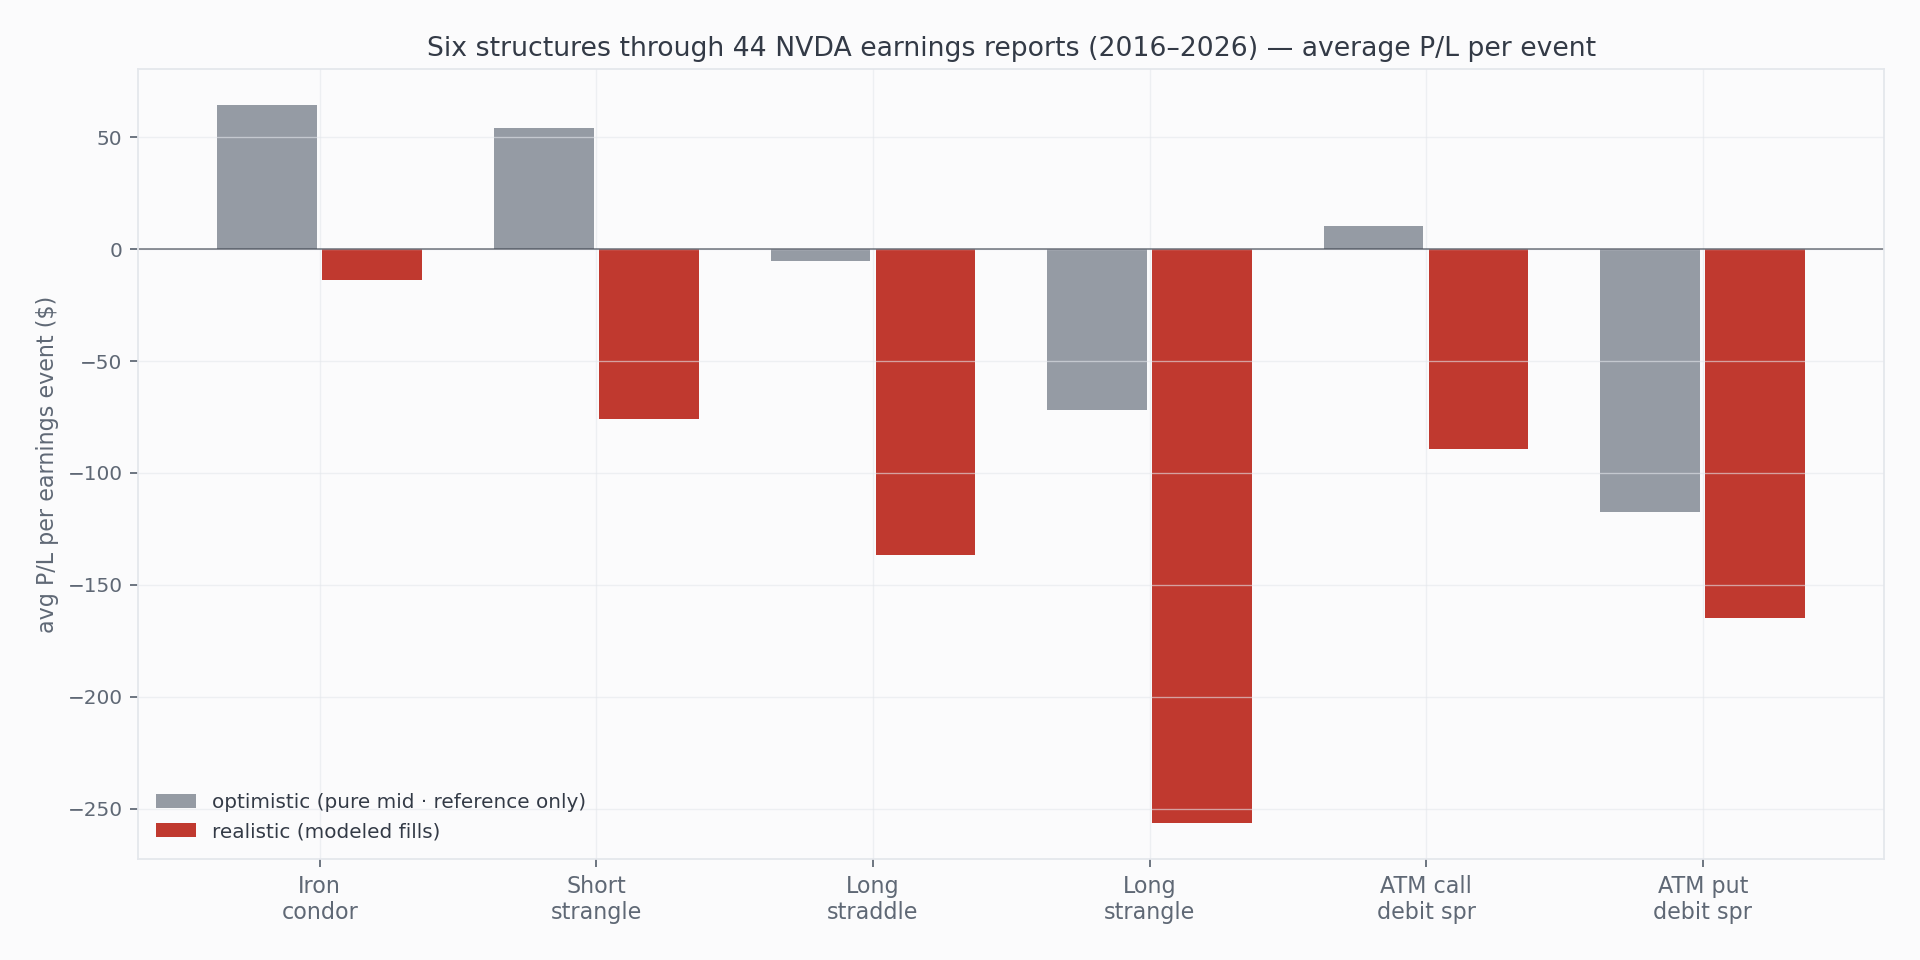
We played every NVDA earnings since 2016. All six strategies lost.
Enter at the close before the report, hold through the reaction, manage with standard rules: six option structures, 44 earnings events, 251 positions. Under realistic fills every structure finished negative — including an iron condor that won 80% of the time — and the two short-volatility structures that looked profitable at textbook midpoint pricing flipped when the spread was paid.
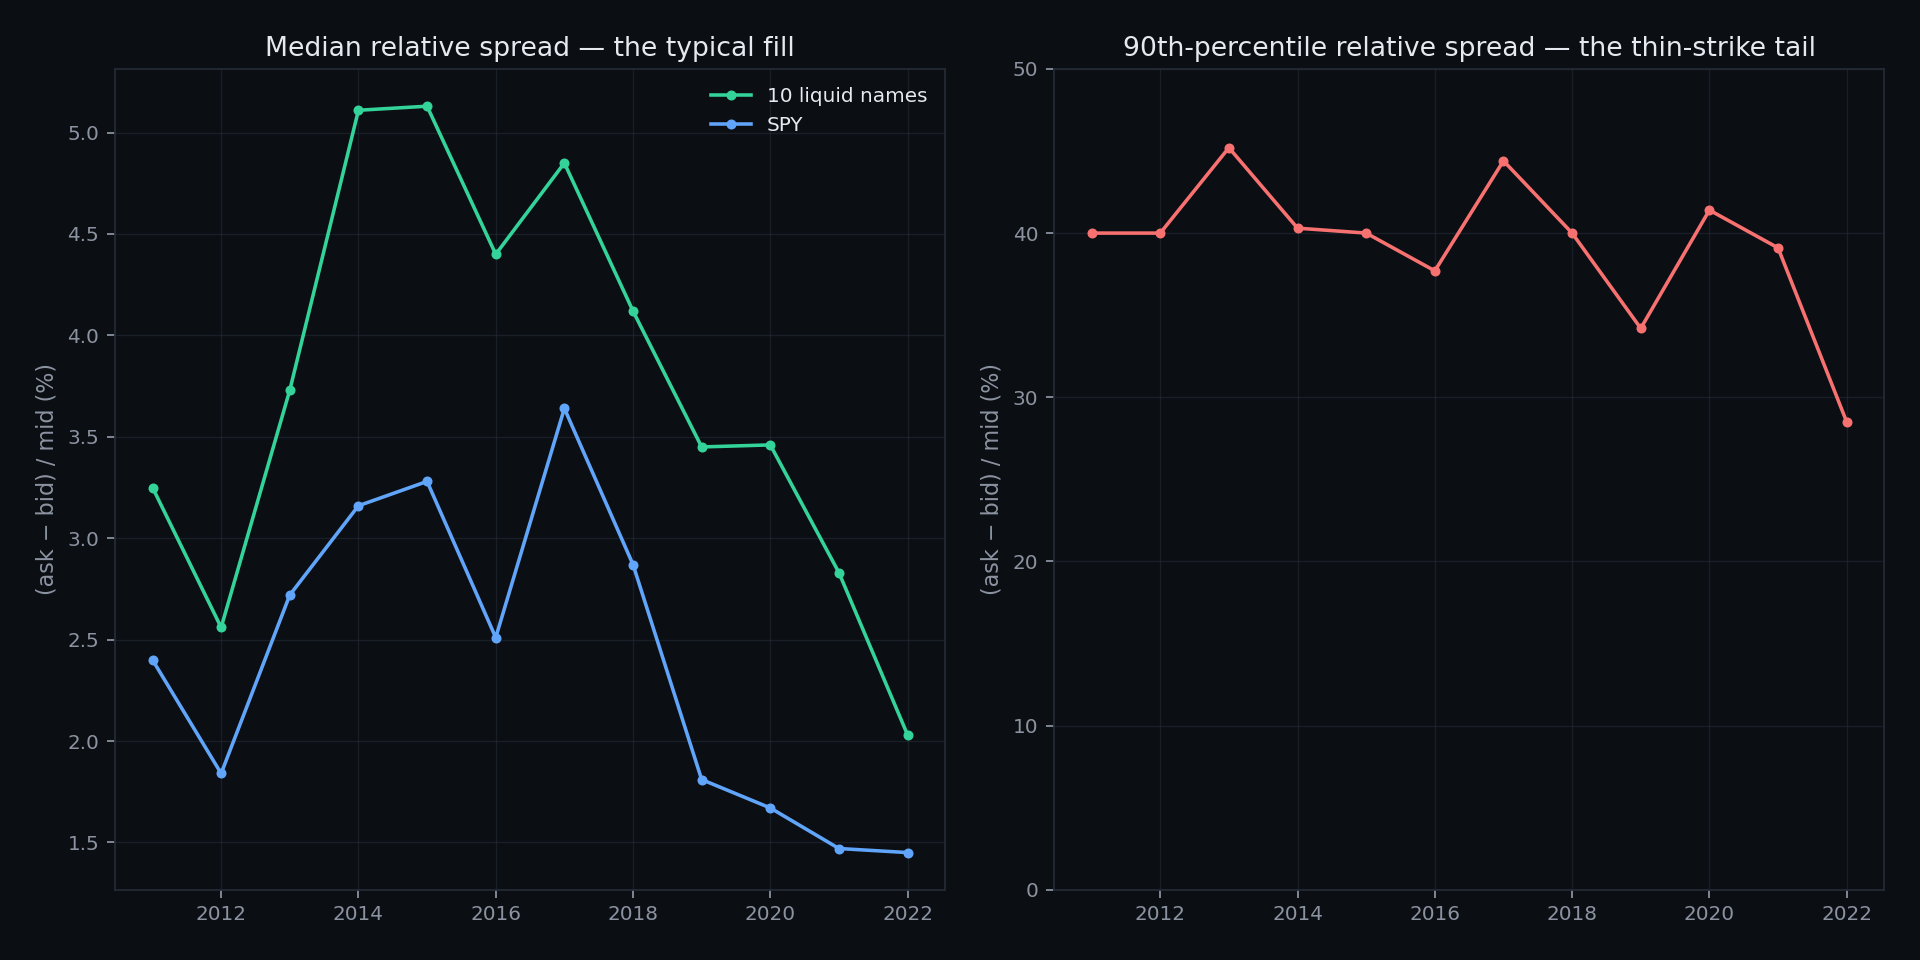
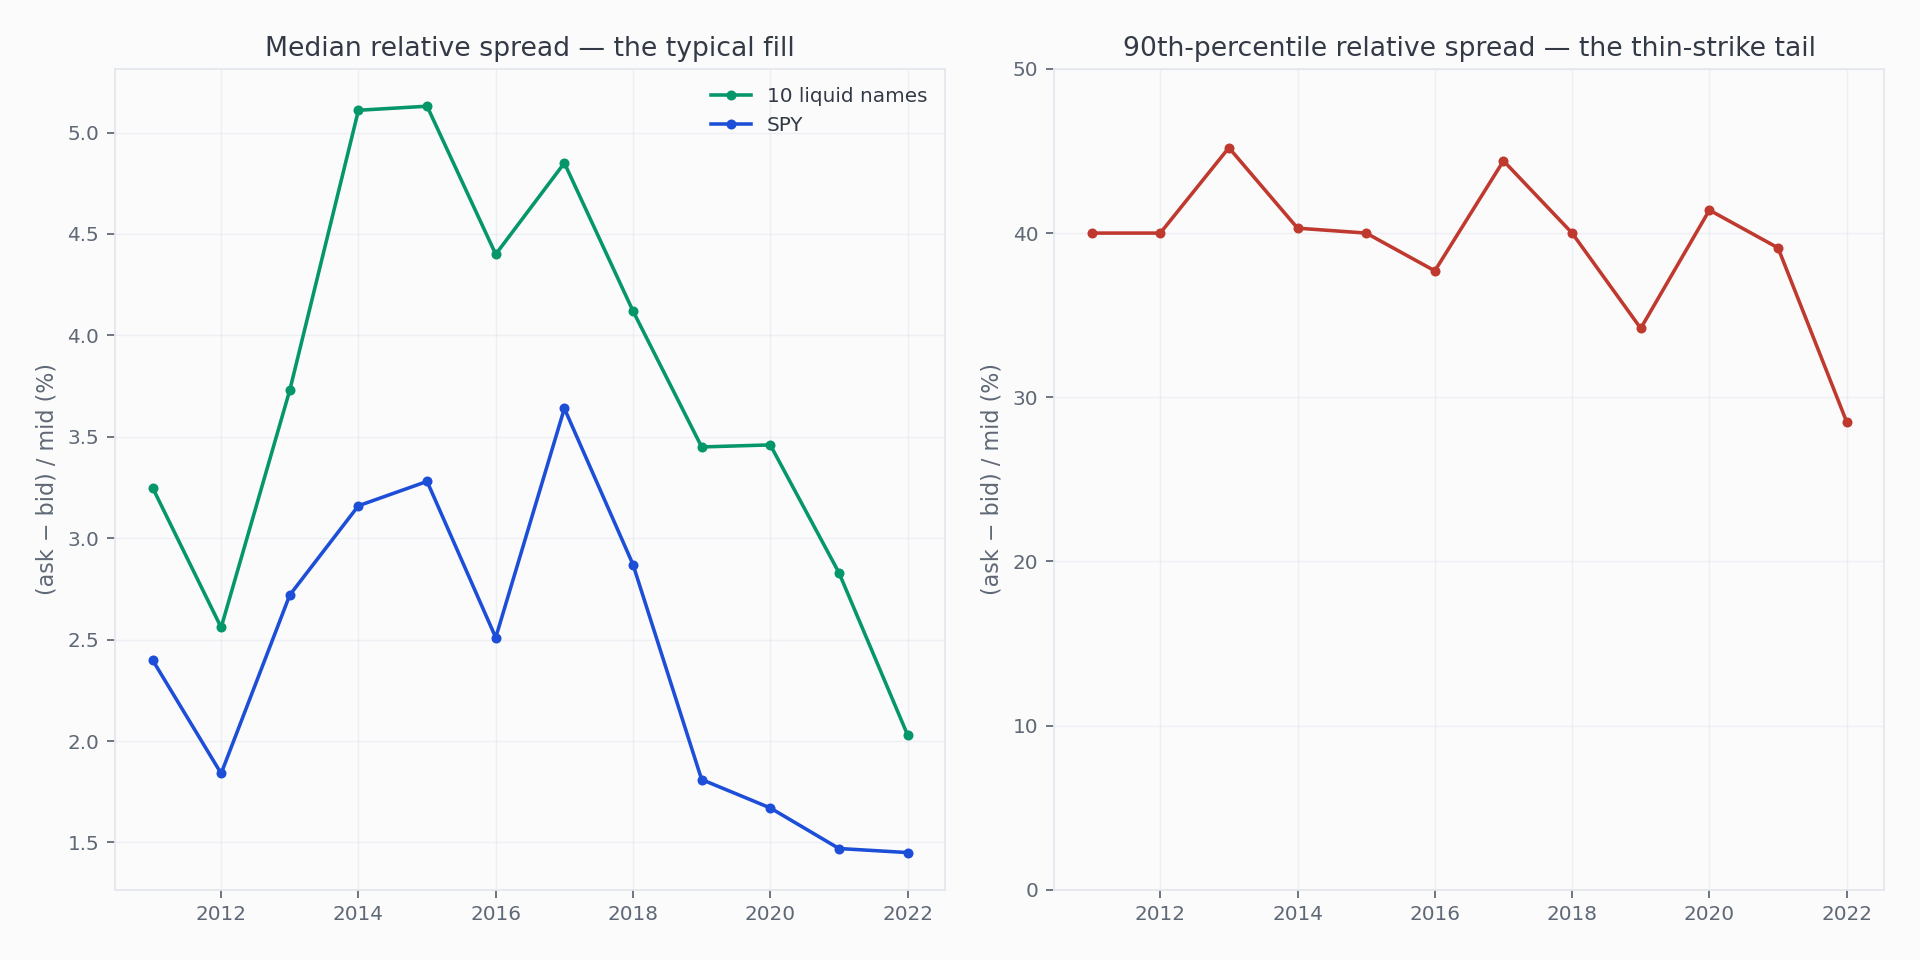
What crossing the spread really costs: 28 million option quotes, 2011–2022
We measured the bid–ask spread on every candidate quote in our archive, then rebuilt our backtest engine so every simulated fill pays it. Median spreads narrowed roughly 2.5× since the mid-2010s; the thin-strike tail stayed brutally wide in every era — and when our own published studies were re-run under the new model, 12 of 22 changed sign.
Does the 45-DTE rule hold up? 13 years of put credit spreads on SPY
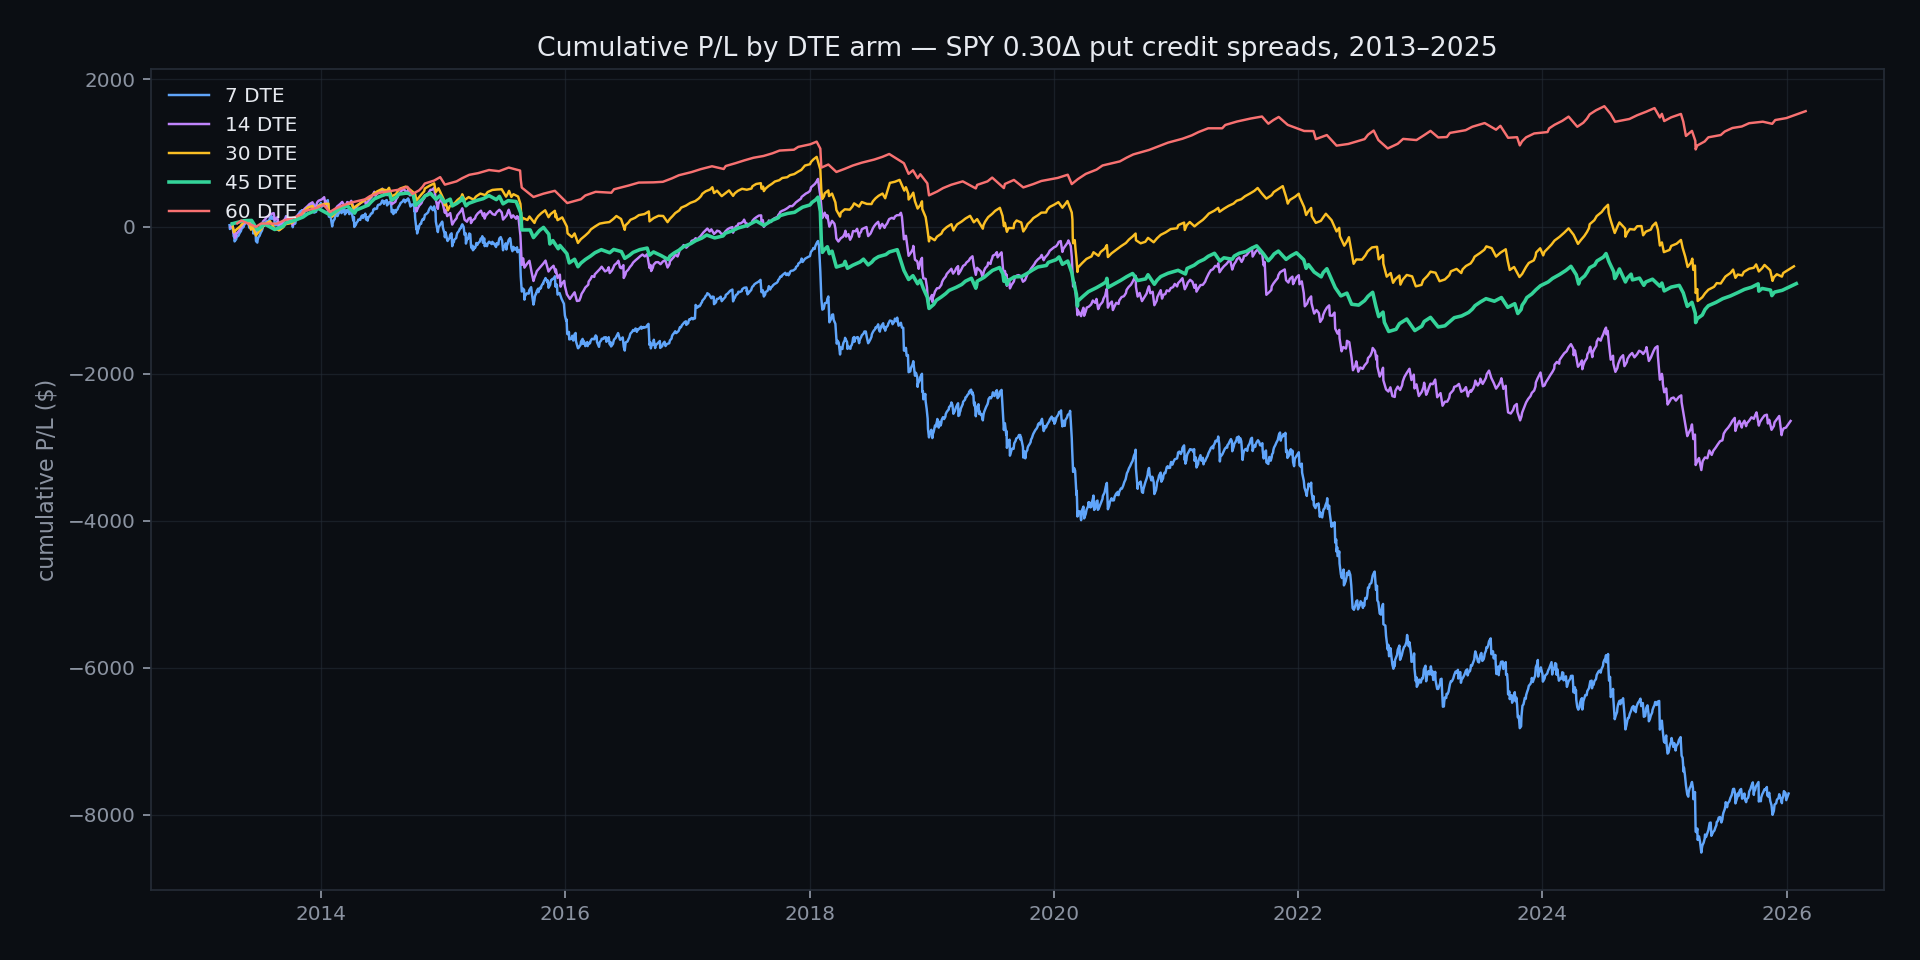
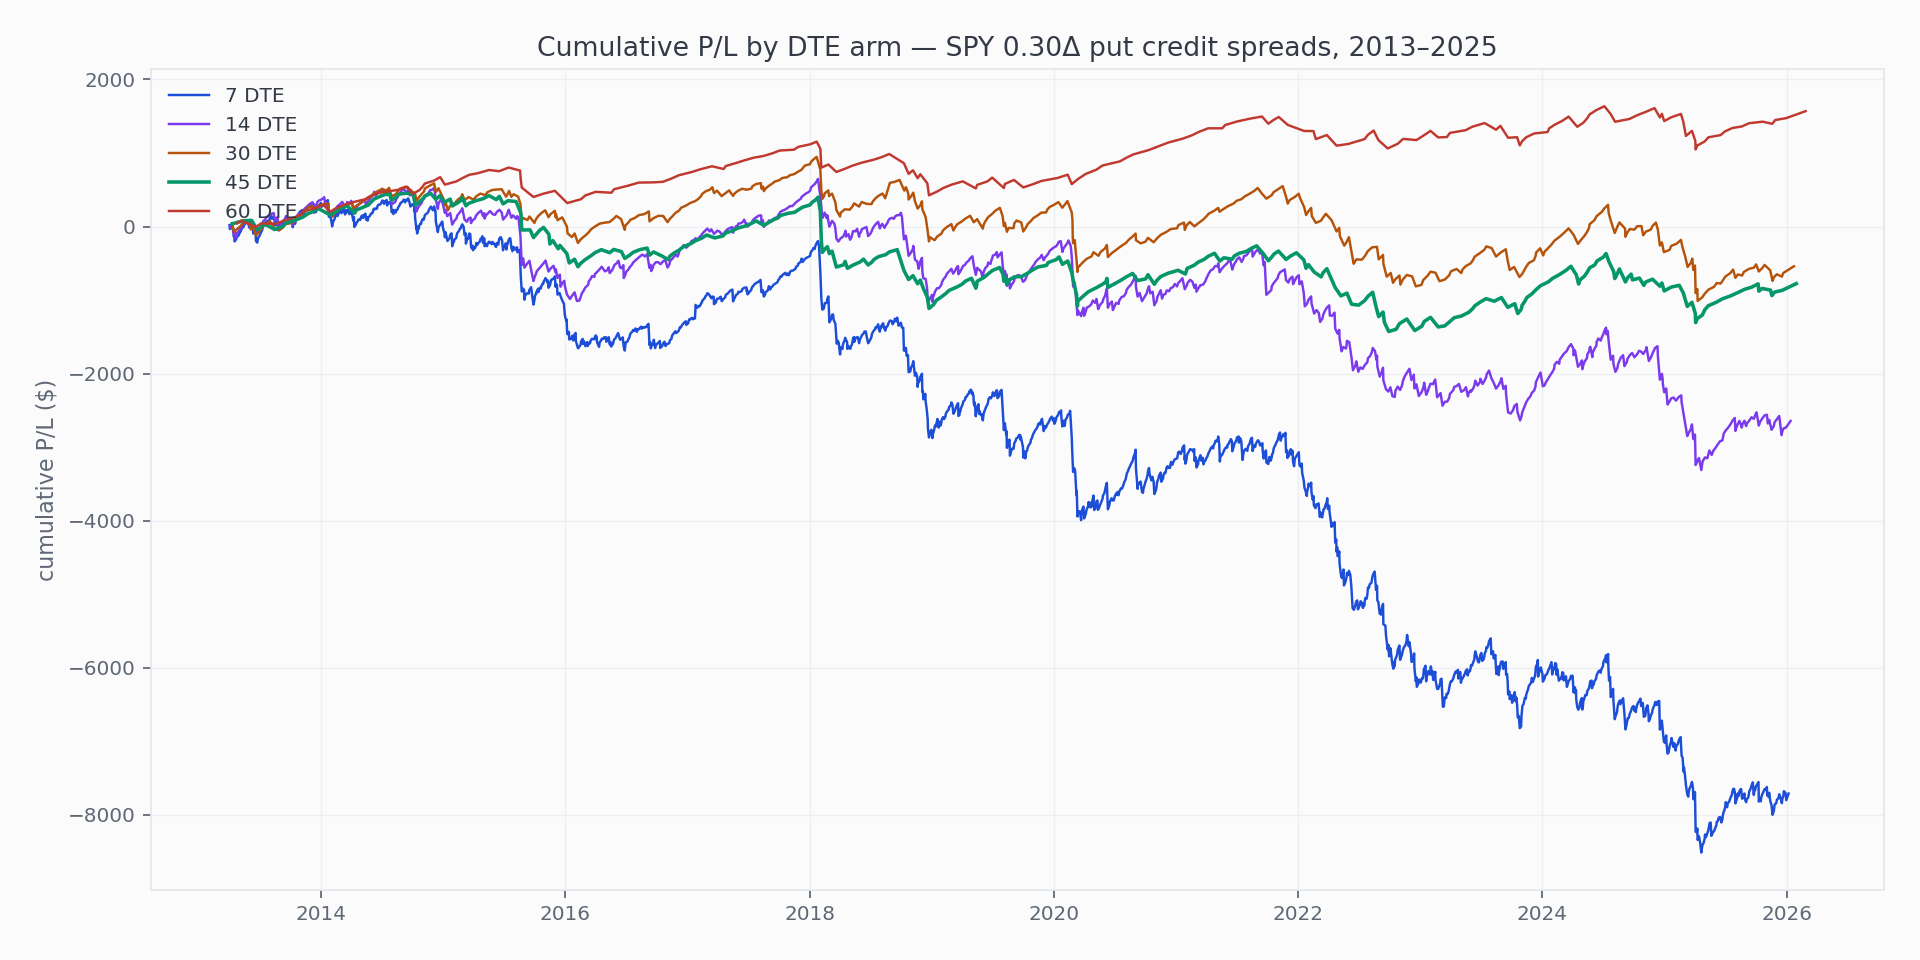
We held delta, width, and management rules constant and varied only days-to-expiration across five arms and 3,711 backtested trades. Under realistic fills the ranking inverts outright: every arm that trades faster than the 60-DTE loses money to the spread it crosses, and only the slowest arm — 194 trades in thirteen years — finishes ahead. The gap between midpoint and realistic fills is the study's real finding.
Iron condors through the 2020 and 2022 drawdowns
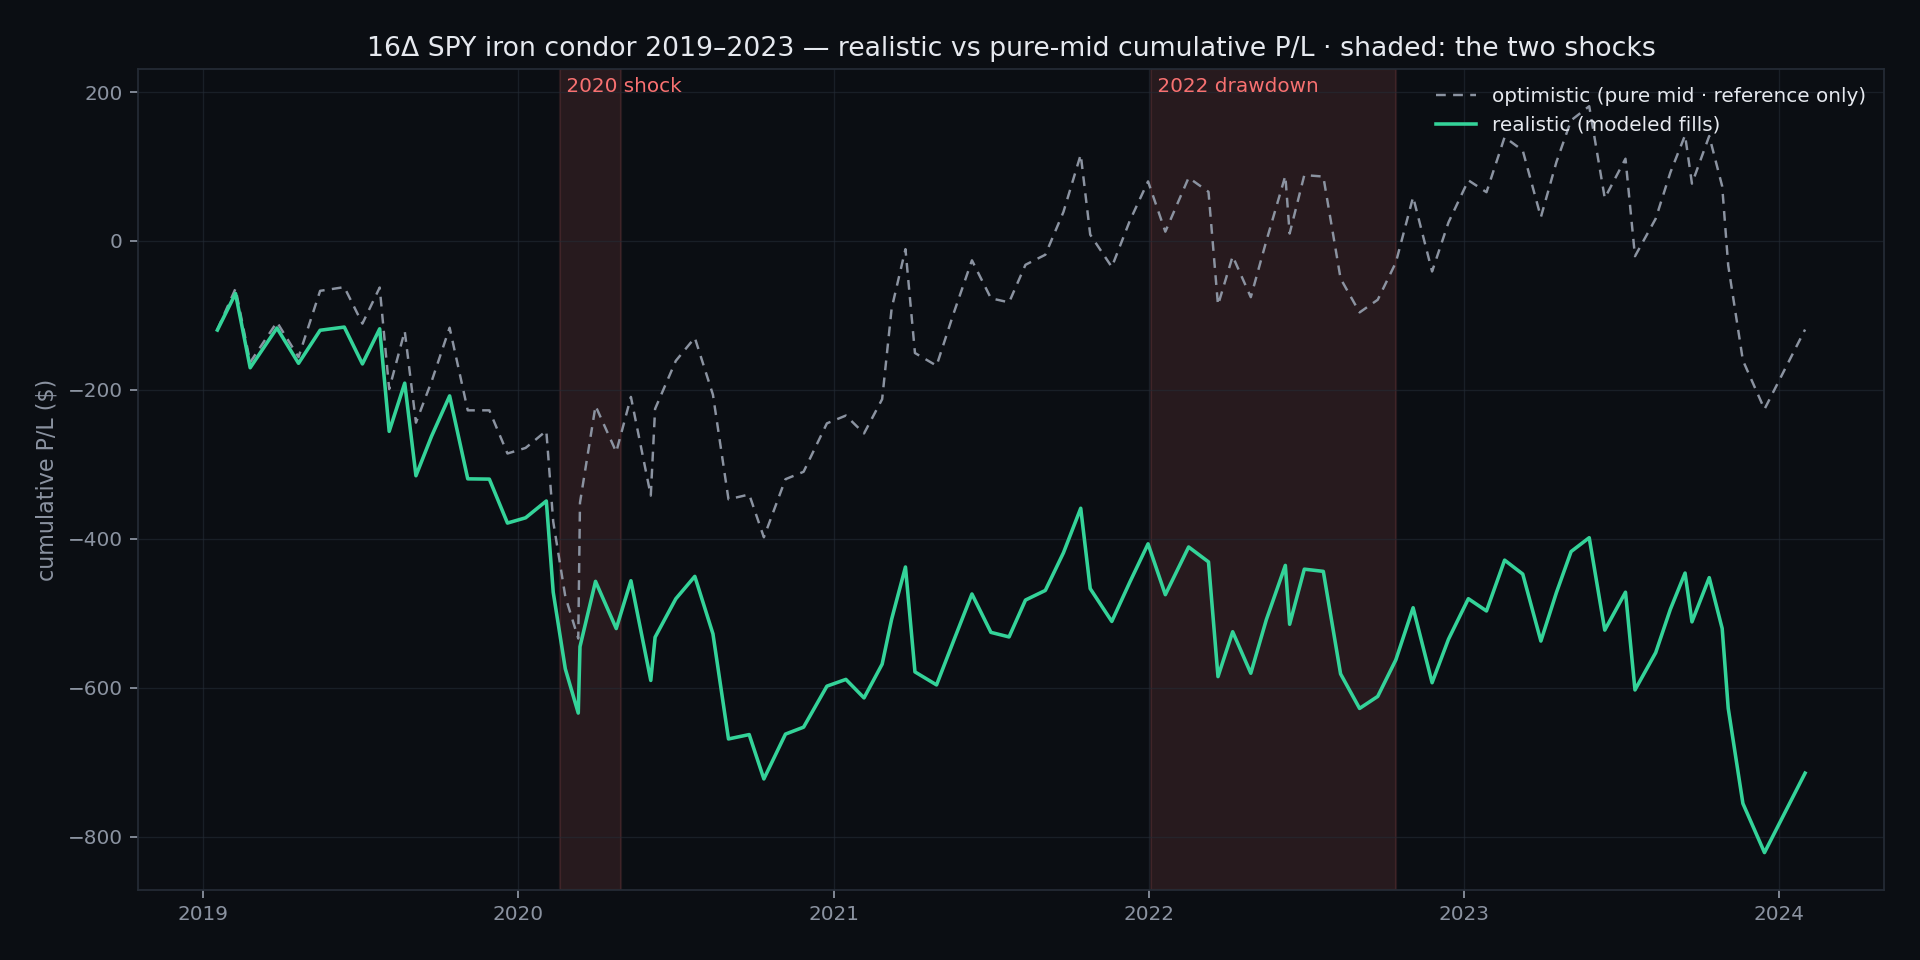
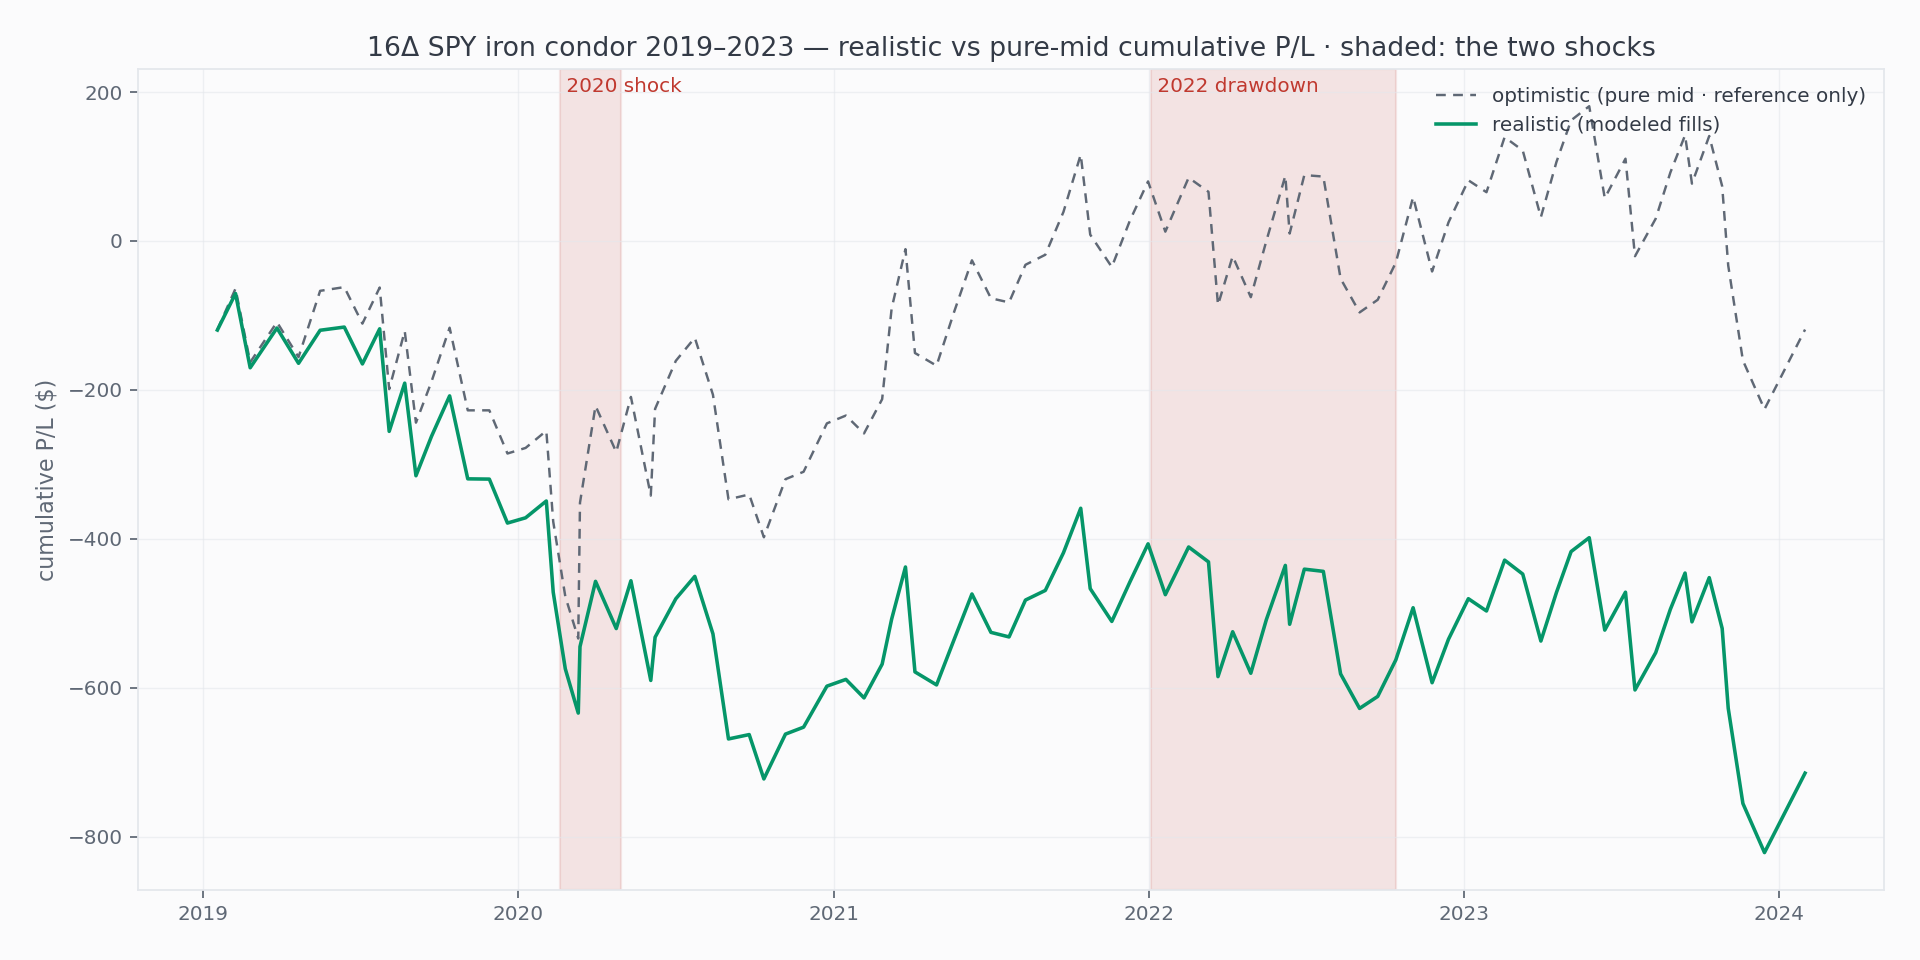
A 16-delta SPY condor run continuously through 2019–2023 finished with a 54.7% win rate and a realistic net of −$715 across 95 trades — −$119 even at pure-midpoint fills. Four legs of spread toll settle the verdict the midpoint model left ambiguous. The average still hides the shape: two volatility shocks did very different kinds of damage.
Earnings weeks: the premium and the price
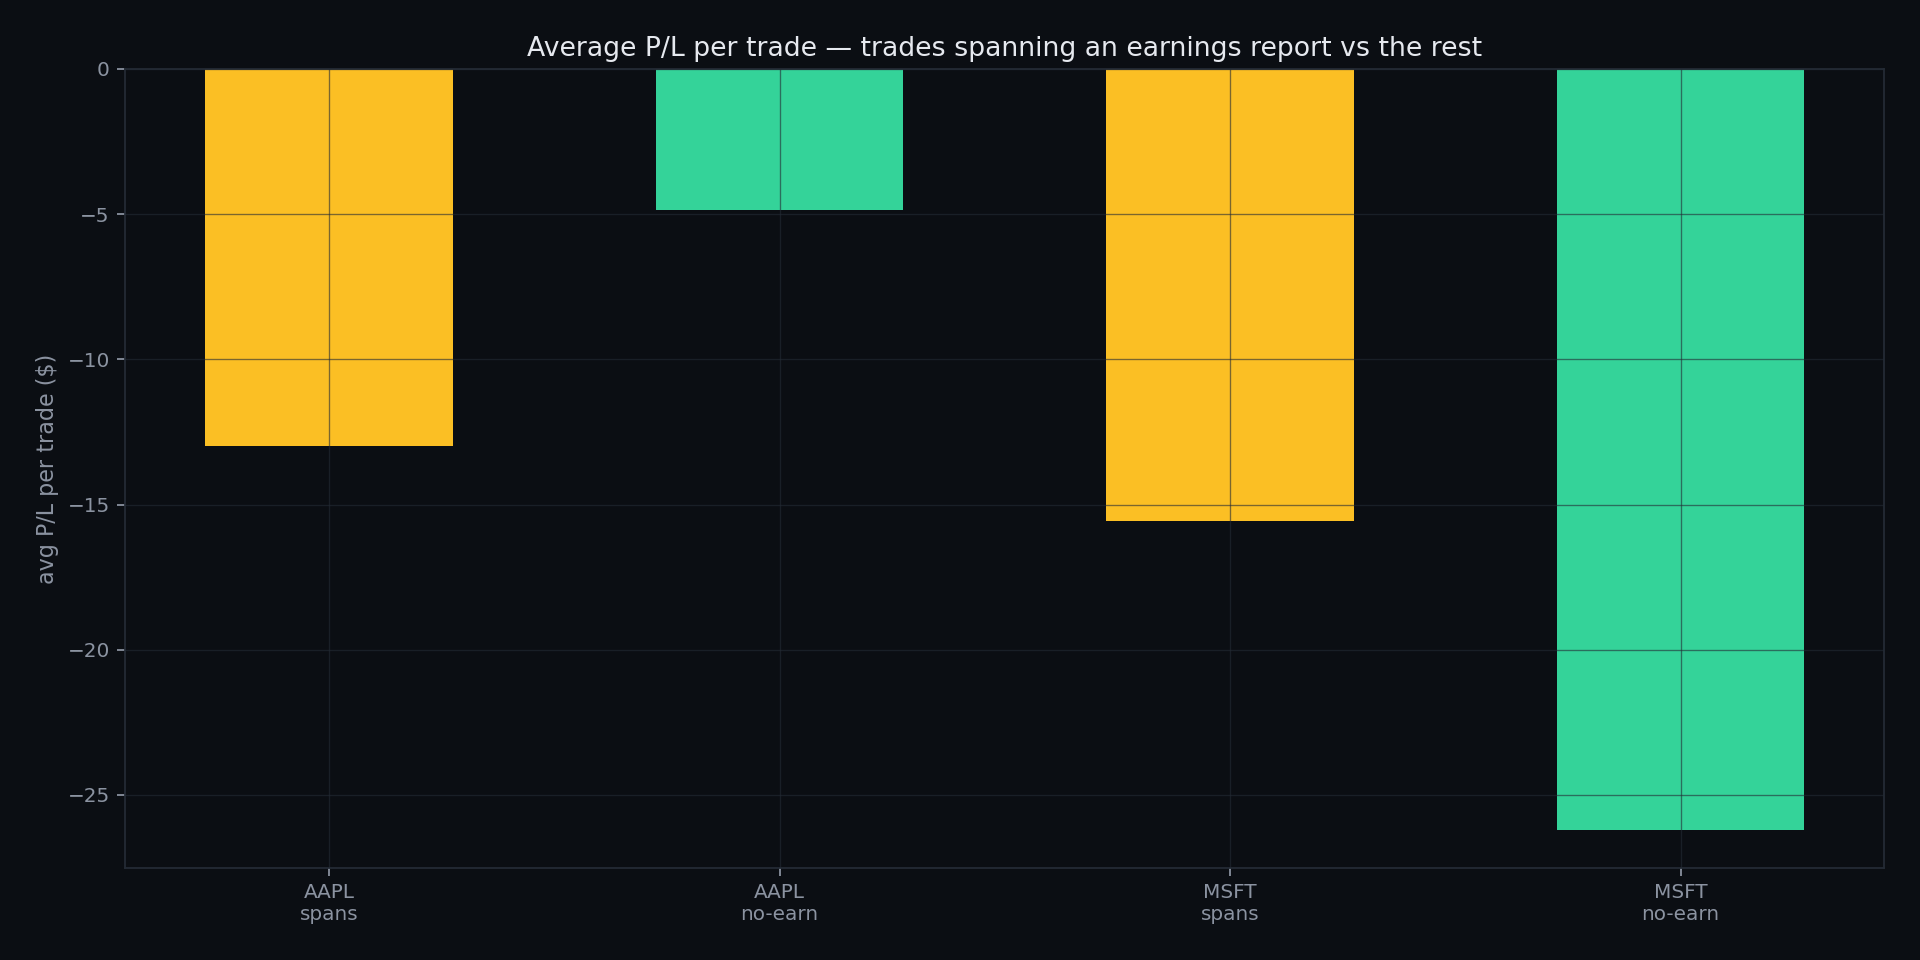
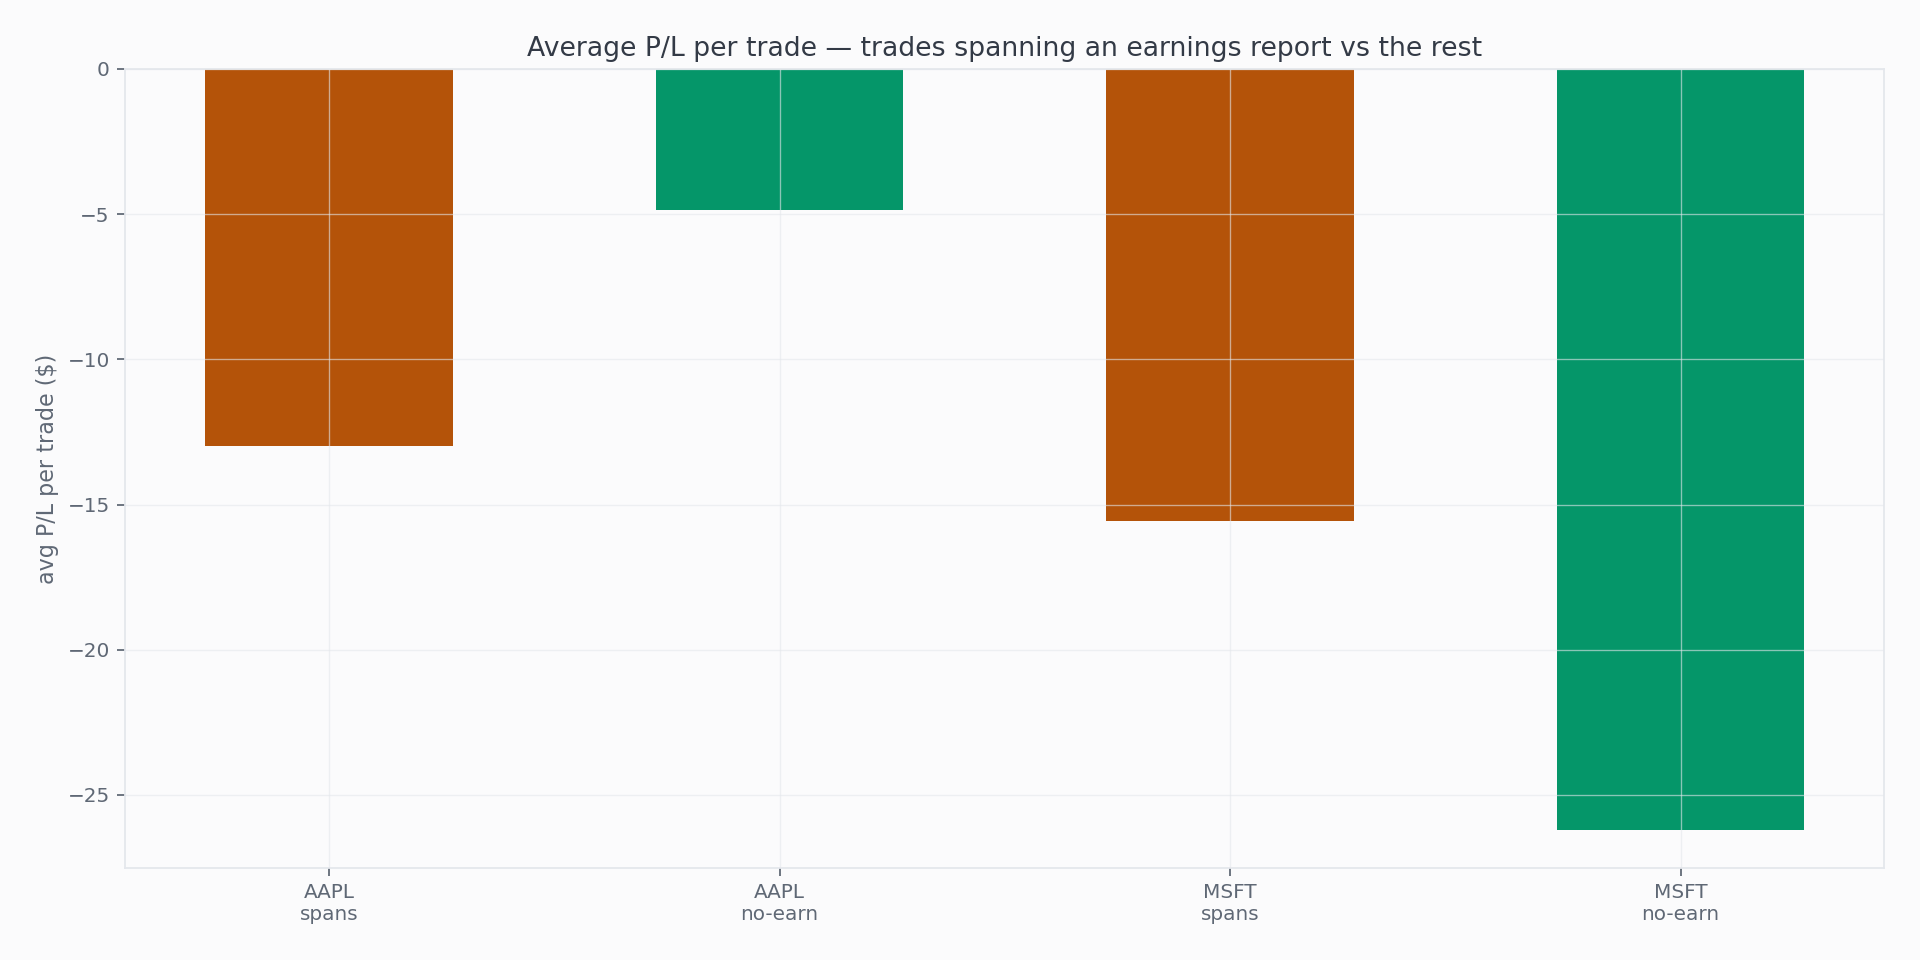
Twelve years of put credit spreads on AAPL and MSFT, split by whether the position spanned an earnings report. At midpoint fills the spanning trades still paid slightly more, and the feared blow-ups still mostly didn't come — but under realistic fills every population on both names is under water. On single names, the tax that matters isn't the earnings gap; it's the spread you cross to play.
Is an IV entry filter worth the days it costs you?
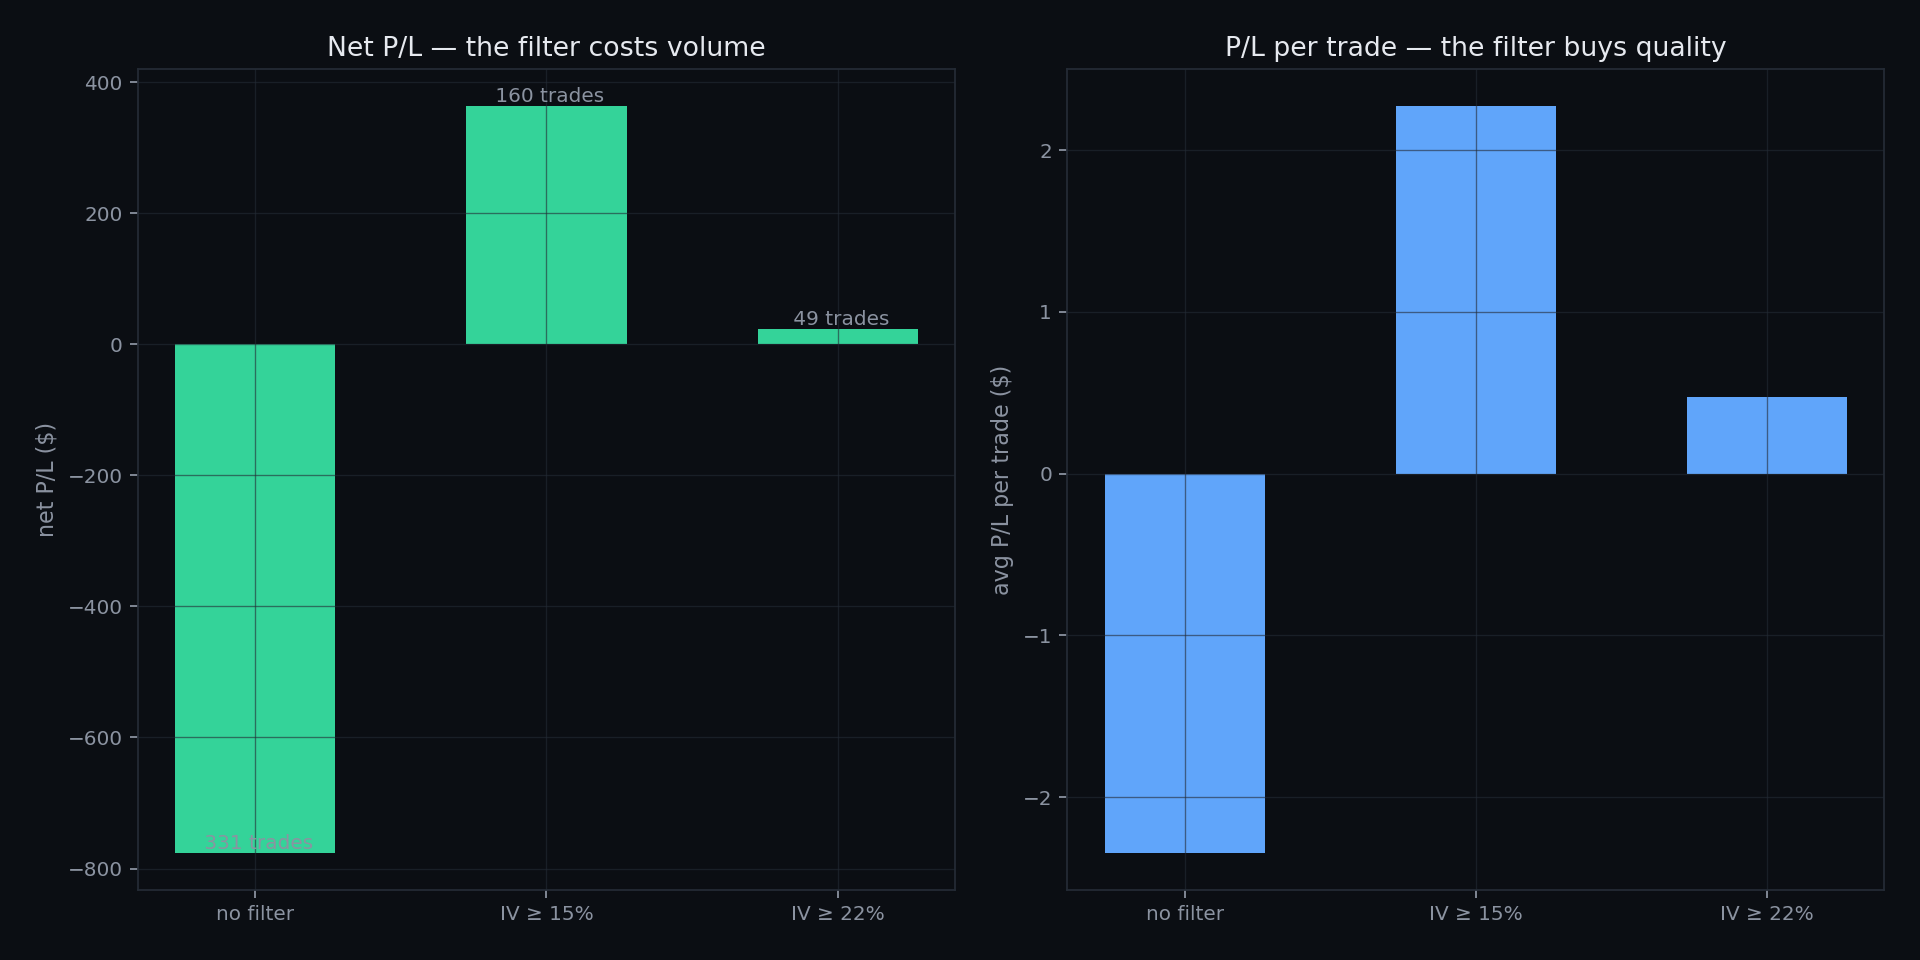
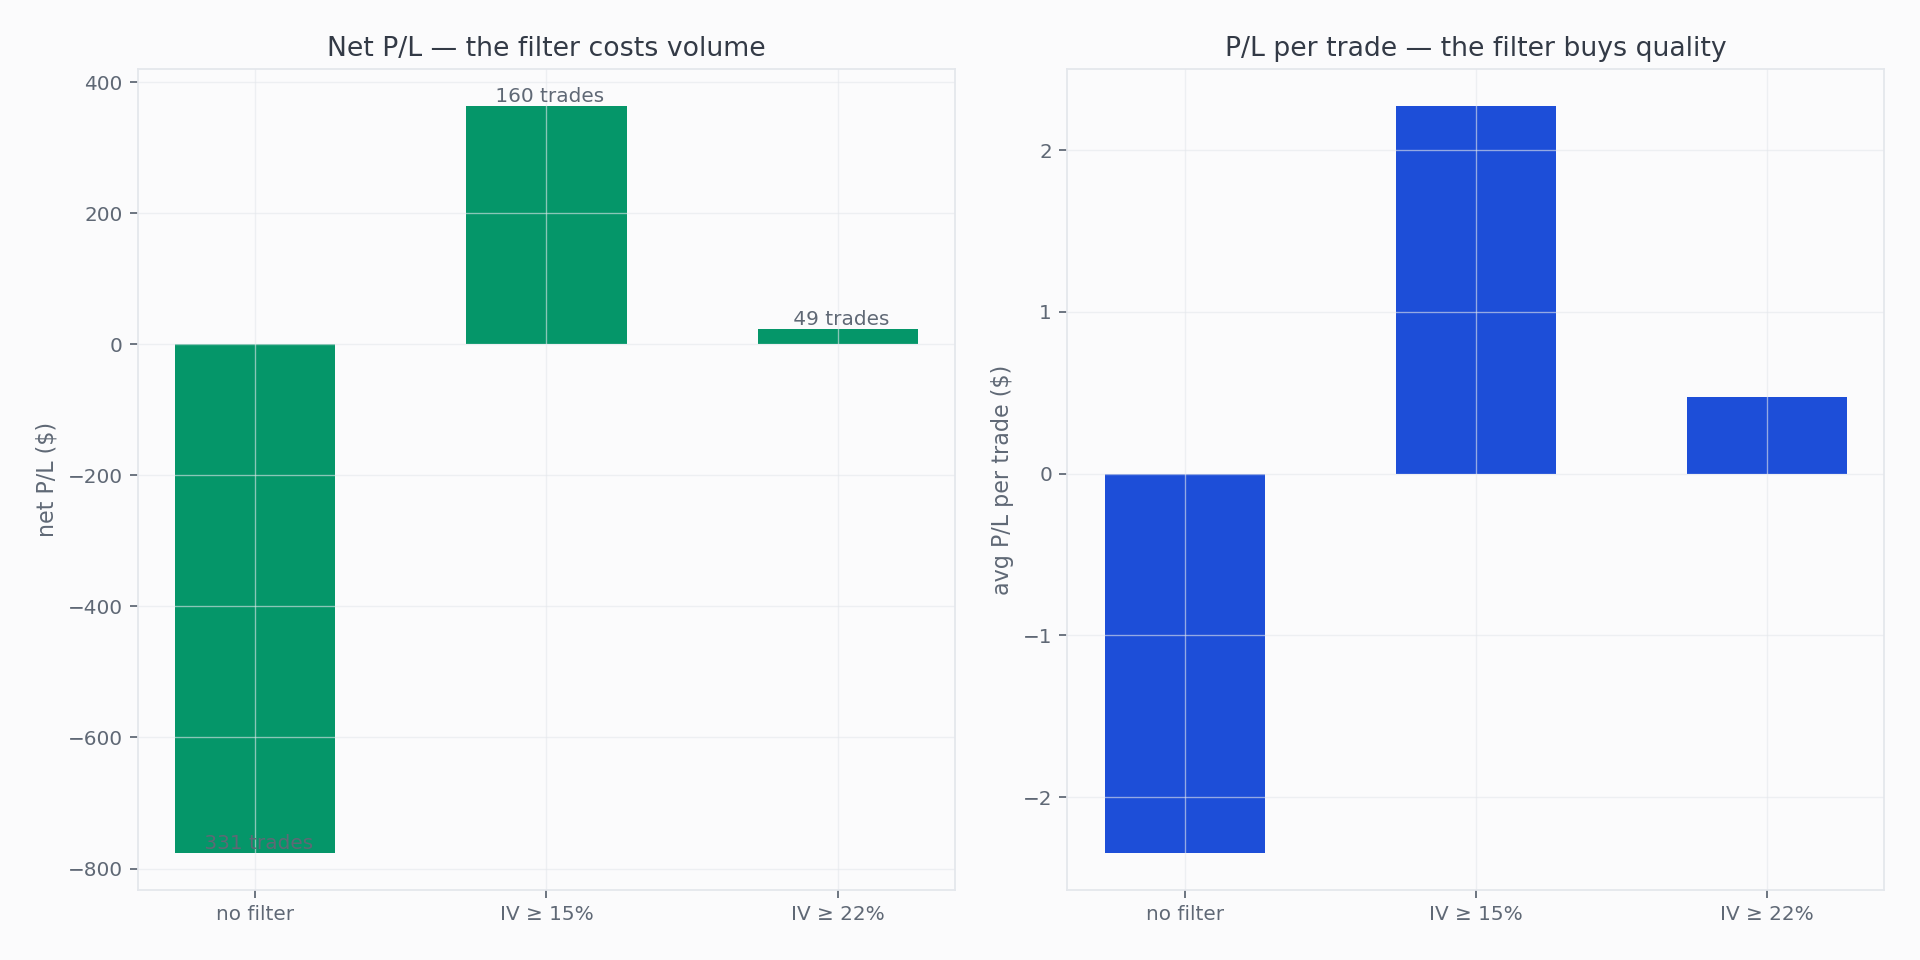
Under midpoint fills the IV gate was a preference — quality up, dollars down. Under realistic fills it is a rescue: the unfiltered baseline loses $776, the ≥15% gate turns the same strategy positive, and the mechanism is exactly the filter's two effects — fewer spread crossings, richer credit per crossing. Tightening further gives most of it back.
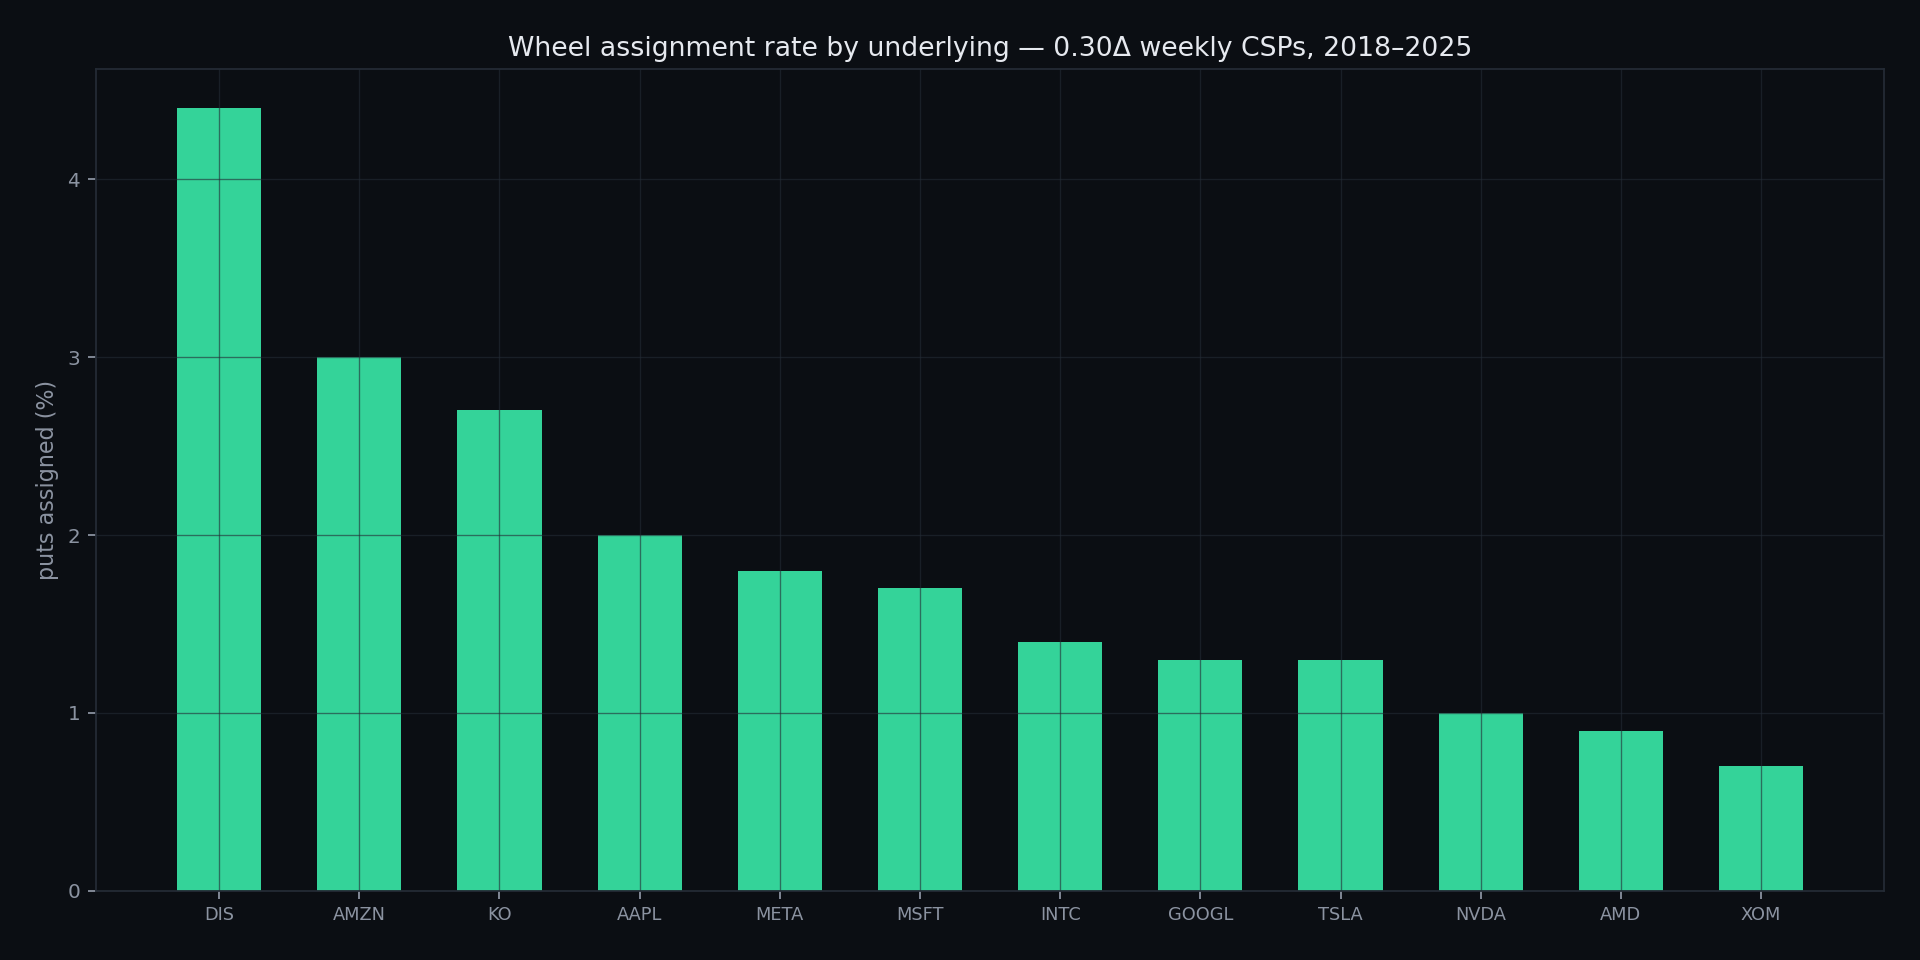
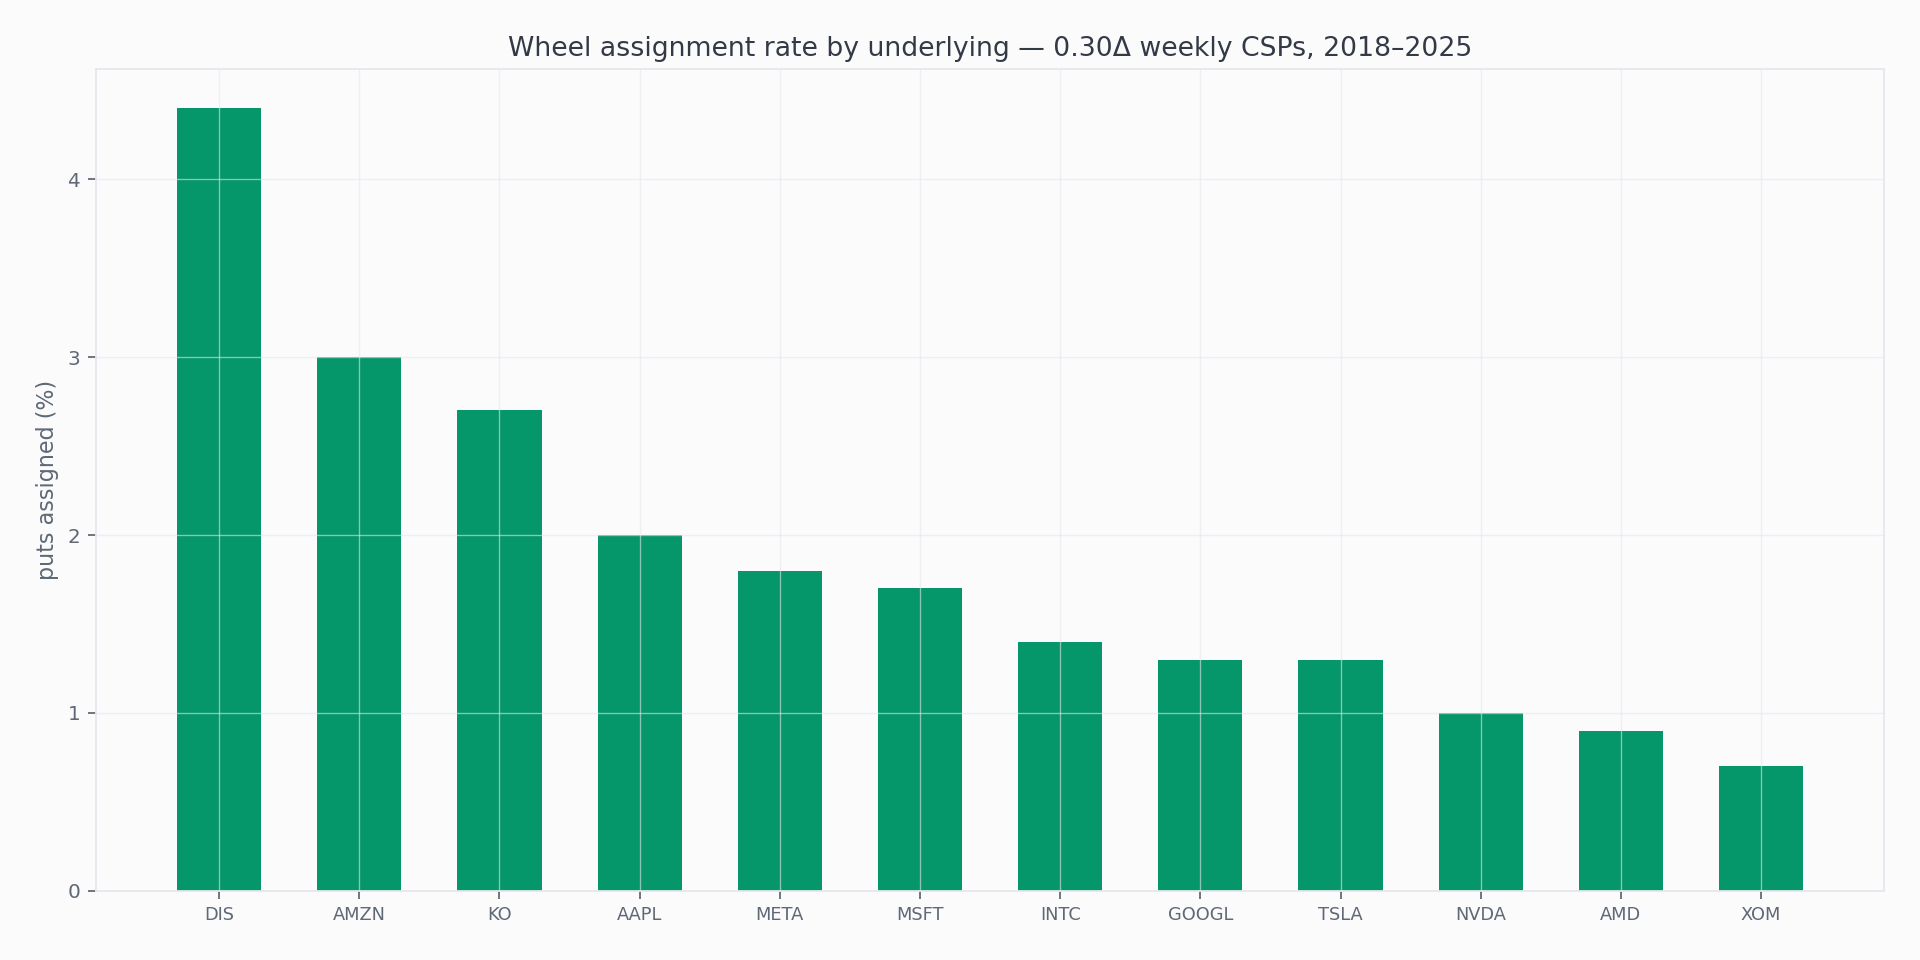
How often does the wheel actually assign?
Eight years of 0.30-delta weekly cash-secured puts across twelve liquid names: 2,585 put positions, 41 assignments — about 1.6%. The wheel's scariest step is also its rarest, because the exits usually get there first.
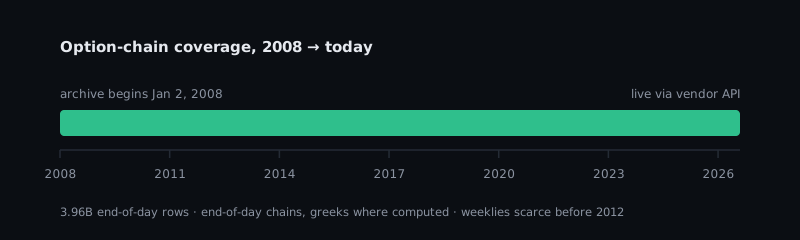
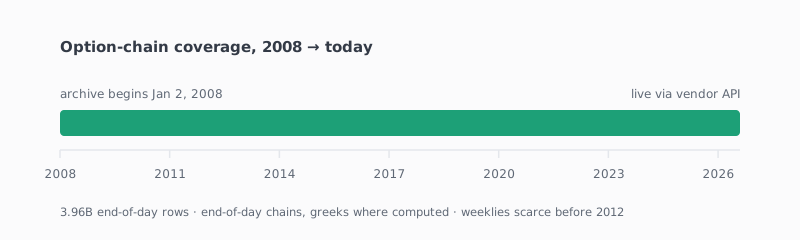
What our historical options data does and doesn't cover
Chain coverage begins in January 2008, and weekly expirations barely existed before 2012. Here's exactly what's in the archive, how we verified it, and how it shapes any long study.
OptionKrafter is an educational and analytical platform. Nothing here is investment advice, a recommendation, or an offer to buy or sell any security. All results shown are hypothetical, simulated backtests on historical data and do not represent actual trading; past performance does not indicate future results. Options involve risk and are not suitable for all investors.
Market data by Intrinio. © 2026 OptionKrafter.