What our historical options data does and doesn't cover
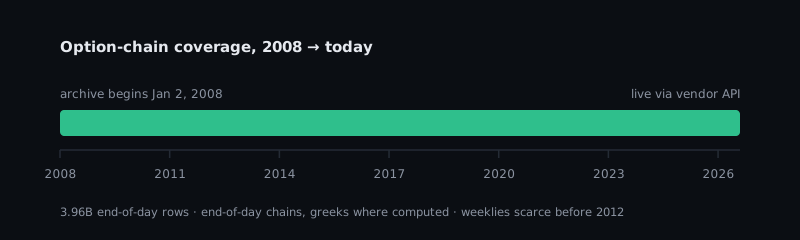
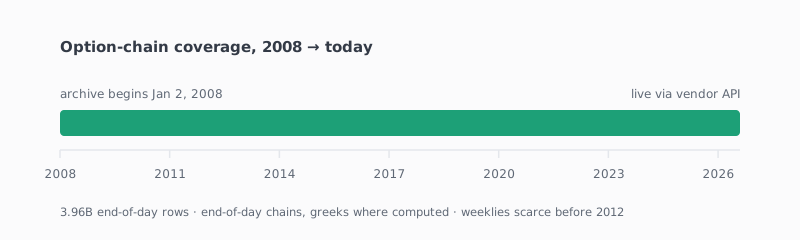
Chain coverage begins in January 2008, and weekly expirations barely existed before 2012. Here's exactly what's in the archive, how we verified it, and how it shapes any long study.
The shape of the archive
Backtests in OptionKrafter run over end-of-day US option chains stored in our own historical warehouse — 3.96 billion rows covering roughly 69,000 underlying-years from January 2, 2008 (the first trading day of that year) to the present. Recent dates are served live from our market-data vendor; the deep history is the same vendor's archive, loaded, audited, and reorganized for fast reads.
Every option row is an end-of-day record: closing price, bid and ask, volume, open interest, and — where the vendor computed them — implied volatility and delta. Every underlying carries full daily OHLC (open, high, low, close) on the as-traded price series. Option data is end-of-day — the standard resolution for options backtesting — so option-priced rules evaluate on daily closes; the underlying’s daily high and low are real data, and the rule class that references the underlying (iron condor breach rules) uses them.
Resolution, and the two data eras
One engine, two data eras, and in each the finest resolution the data supports. Windows starting April 2023 or later evaluate minute by minute — automatically, on paid plans, with no setting to choose. Windows reaching earlier than that, and every wheel backtest (v1), evaluate end-of-day, exactly as described below. For the deep era — 2008 through March 2023 — the argument is unchanged:
For the deep era — 2008 through March 2023 — OptionKrafter is an end-of-day engine, by design (windows starting April 2023 or later evaluate minute by minute). Daily bars are what make eighteen years of option history tractable and every result reproducible; they match how rule-based options strategies are actually traded — entered and managed once a day, on rules, not on a screen watch; and they resist the curve-fitting that minute-by-minute noise invites. The resolution is part of the method, and every study states it.
The engine then extracts more from each trading day than a standard midpoint backtest even attempts: full daily OHLC on every underlying, so the day’s true high and low drive every rule that references the underlying’s price; closing bid/ask on every option; and spread-priced fills on every leg, with the realistic and the pure-mid figure printed on every run. Execution modeling — not tick resolution — is where a backtest earns or loses its credibility, and it is where this engine leads.
Breadth: All US tickers
Coverage isn’t only about dates. The archive spans every US-listed stock and ETF with traded options — small caps, recent listings, thinly covered ETFs, and names that have since delisted — each reaching back to 2008 subject to its own listing history. There is no curated shortlist. Every plan, including Free, covers the full universe.
The floor: January 2008
No backtest can start before 2008-01-01, on any plan. That's not a pricing decision — it's where the archive begins. How far back your backtests reach is set by your plan's reach-back window, up to the full archive on the top tier.
Market structure is part of the data
Weekly expirations barely existed before 2012 — most names listed only monthly series, and even SPY's weeklies ramped up gradually. A strategy that wants to enter every week with ~7 DTE simply couldn't find those contracts in 2009, so early-era backtests trade more sparsely than modern ones. That's not missing data; the engine trades what was actually listed, and a long study inherits the market's own history.
The same applies to greeks: implied volatility and delta are the vendor's end-of-day computations, and legacy-era chains occasionally lack them (a few percent of rows in the early years, near zero from 2022 on). Rules that need an unavailable value — a delta target, an IV filter — skip the day and count it, rather than silently passing.
How we verified it
The warehouse load is audited, not assumed: every source file is checksummed, every partition is checked for row counts and date coverage against the source, duplicate contract-days are scanned per year, and the loader refuses to publish a partition set that fails verification. The coverage picture above — the floor, the greek gaps — comes out of that audit, and it's the same data every user's backtest reads.
What this means for reading long studies
- Pre-2012 results underrepresent short-DTE strategies. Fewer listed expirations means fewer entries — a per-trade view matters more than totals there.
- 2008–2009 is in the data, and it's brutal. The financial crisis is fully covered, which is exactly why deep history is worth having: a strategy that only ever saw 2013–2021 has never met a real bear market.