Does the 45-DTE rule hold up? 13 years of put credit spreads on SPY
We held delta, width, and management rules constant and varied only days-to-expiration across five arms and 3,711 backtested trades. Under realistic fills the ranking inverts outright: every arm that trades faster than the 60-DTE loses money to the spread it crosses, and only the slowest arm — 194 trades in thirteen years — finishes ahead. The gap between midpoint and realistic fills is the study's real finding.
Updated Aug 23, 2026 — Re-run under engine rev 3 — figures now include modeled fills. Tables show realistic (slipped fills — the headline) and optimistic (pure mid · reference only). See the methodology.
"Sell 45 days out, manage at 21" is repeated often enough that it functions as a default. It has a plausible mechanism behind it — theta decay accelerates into the final month, so you collect the fastest part of the curve while keeping enough time to be wrong. What it rarely gets, at least in public, is a like-for-like test across a long window with the management rule scaled fairly to every arm.
This study runs that test on SPY put credit spreads: same delta, same width, same profit target and stop, same universe of entry days — only the DTE changes. Every number below comes from runs in the OptionKrafter engine with the parameters listed at the end.
Method
The engine attempts an entry every trading day from April 2013 through December 2025. While a position is open, entry days are skipped — one position at a time, no laddering, so the arms differ in trade count rather than capital at risk per day.
- Structure: put credit spread, short leg targeted at 0.30 delta, $5 wide, one contract.
- Exits: 50% of credit as the profit target, 200% of credit as the stop, and a time exit at half the entry DTE. First condition to fire closes the position.
- Why "half the entry DTE": the folklore rule manages a 45-DTE position at 21 — roughly halfway. A fixed 21-DTE exit is impossible for the 7- and 14-day arms (they're born past it), so every arm exits at half its life: 4 / 7 / 15 / 21 / 30. The 45-arm reproduces the classic rule exactly; every other arm gets the same proportional treatment.
- Fills: per-leg spread-fraction slippage at the two-leg default (each leg fills 0.66 of the way across the day’s closing bid/ask), no commissions. The tables also show the pure-midpoint figure — the band between the two is the execution cost this study used to exclude.
- Arms: 7, 14, 30, 45, and 60 DTE at entry, snapped to the nearest listed expiration.
End-of-day by design: like every OptionKrafter backtest, this study runs on daily bars — the resolution that keeps years of history reproducible and matches how rule-based options strategies actually trade — with full daily OHLC on the underlying, spread-priced fills on every leg, and both the realistic and pure-mid figure reported. Run under engine rev 3 (end-of-day). Windows from Apr 2023 now evaluate minute by minute; this study has not been re-run. How the engine models fills →
Results
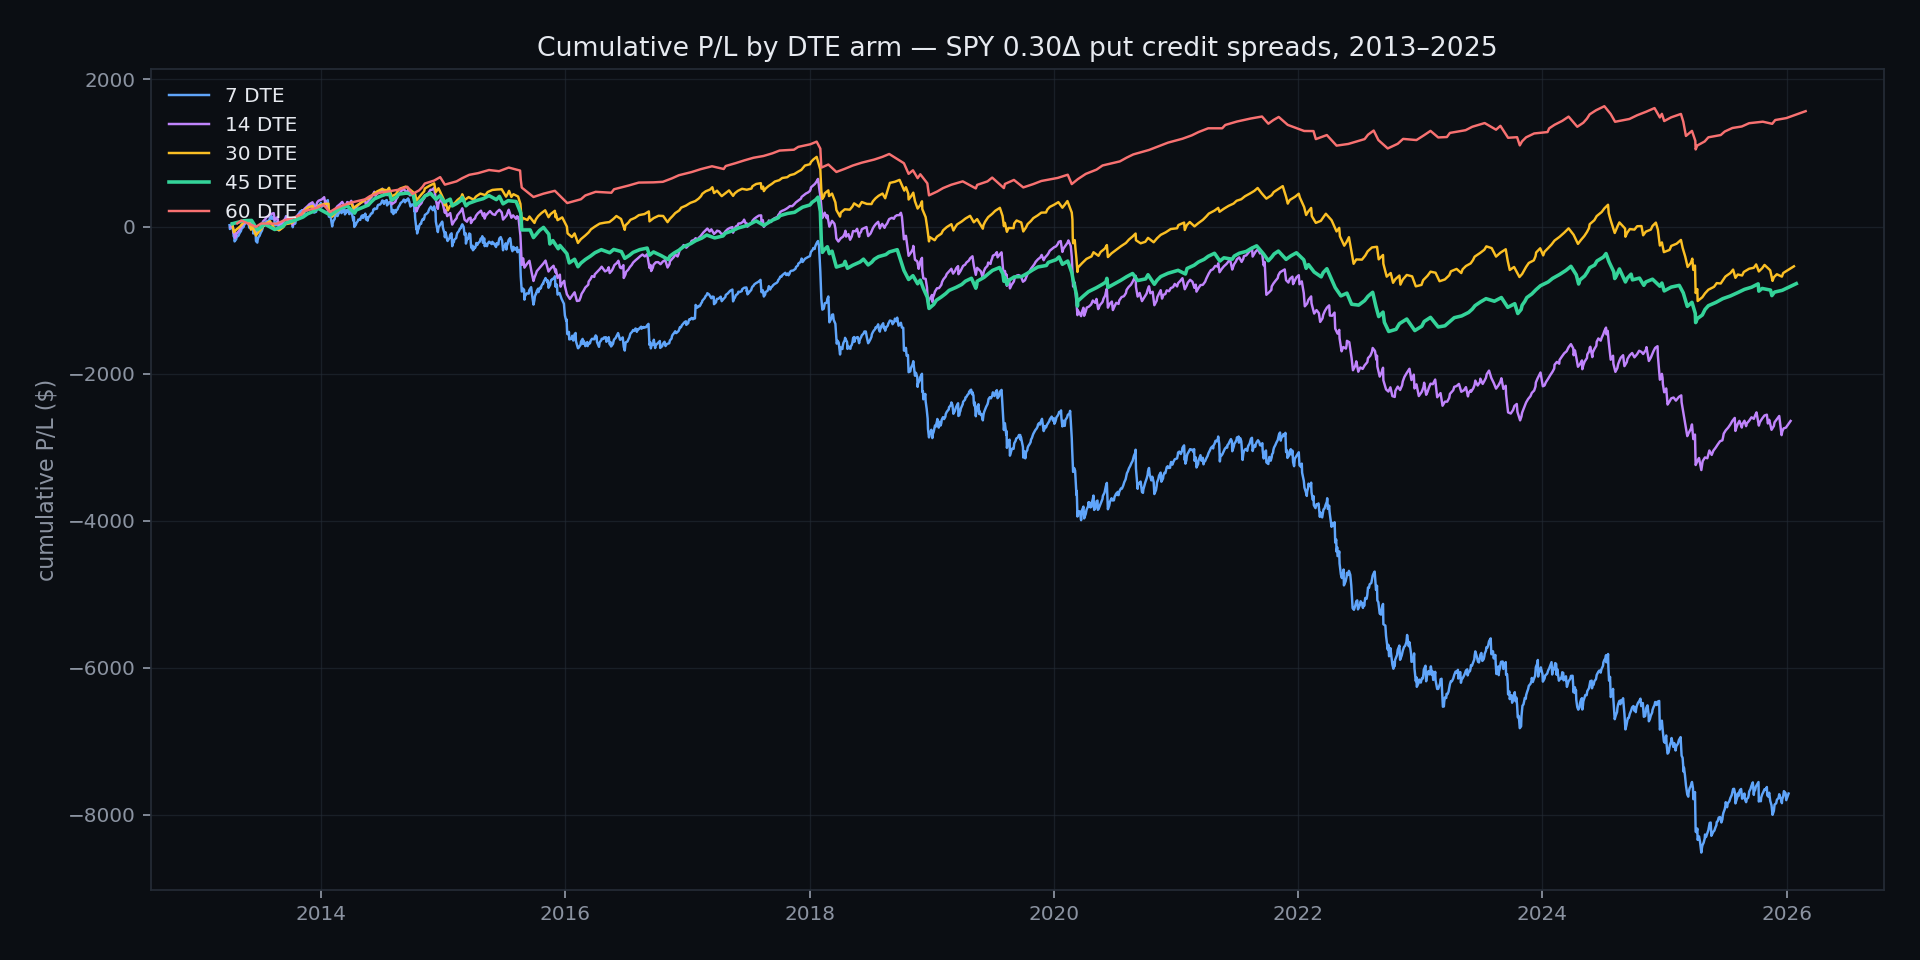
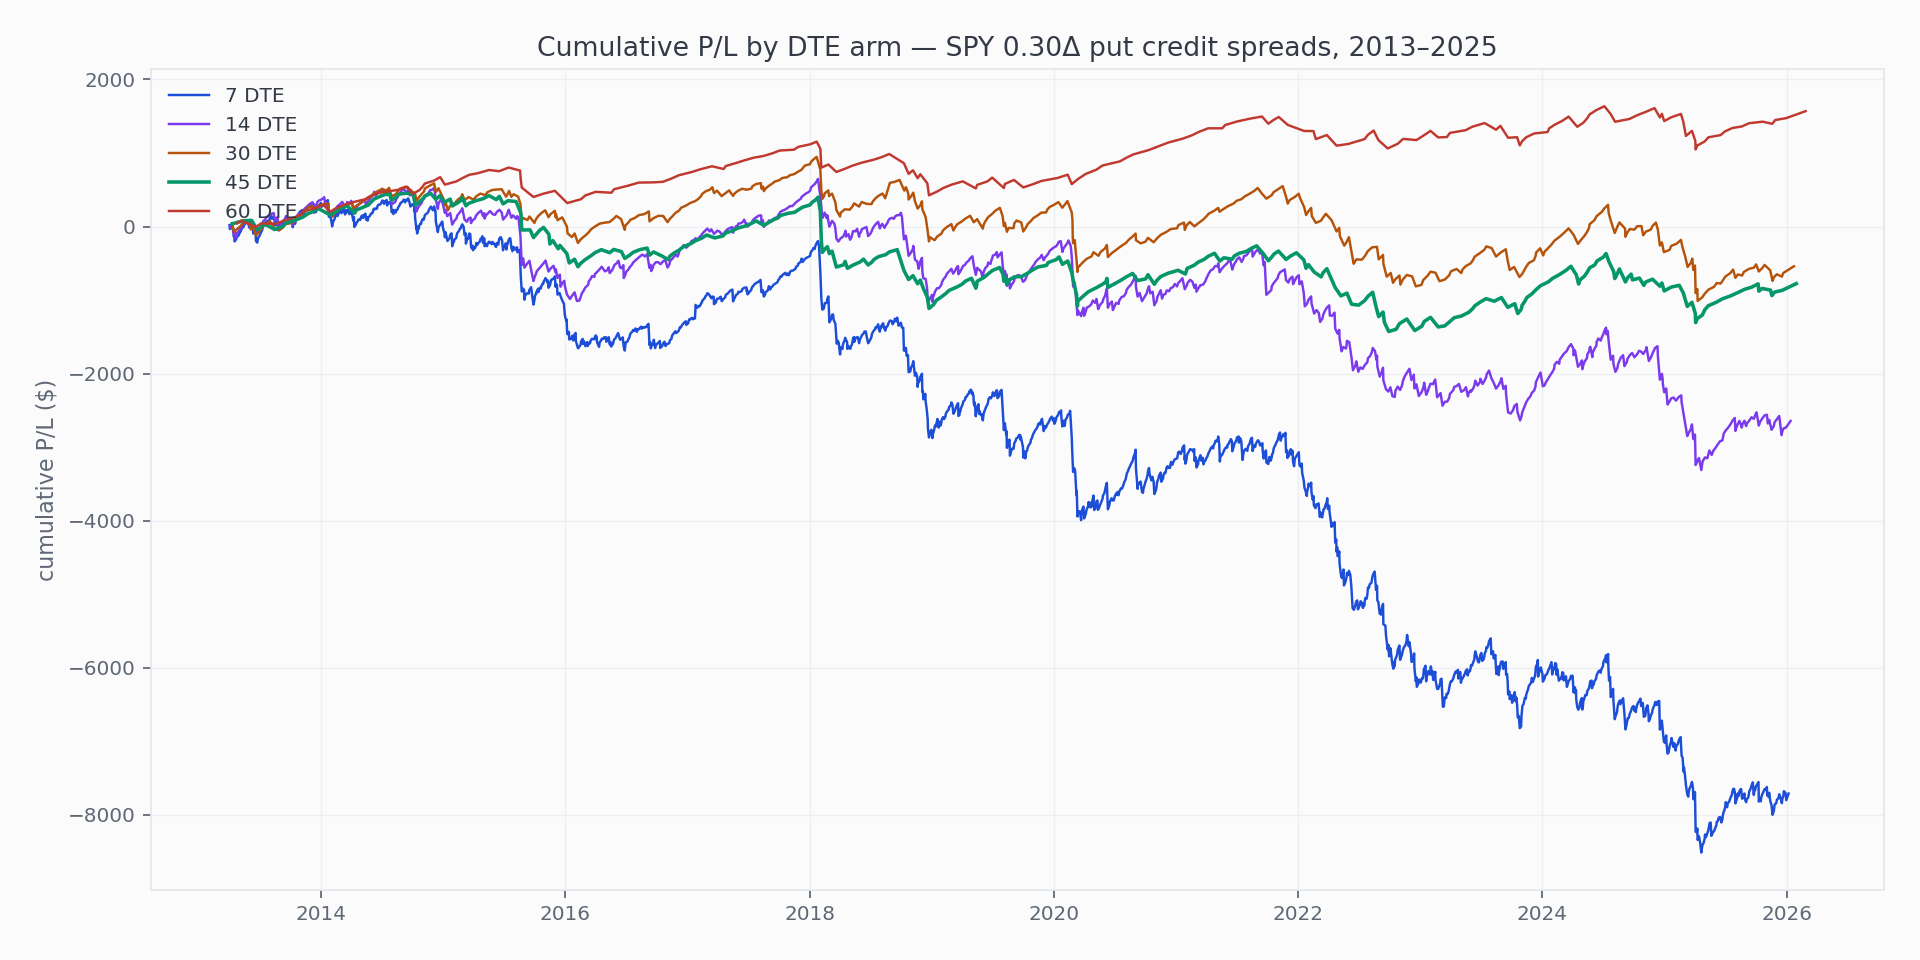
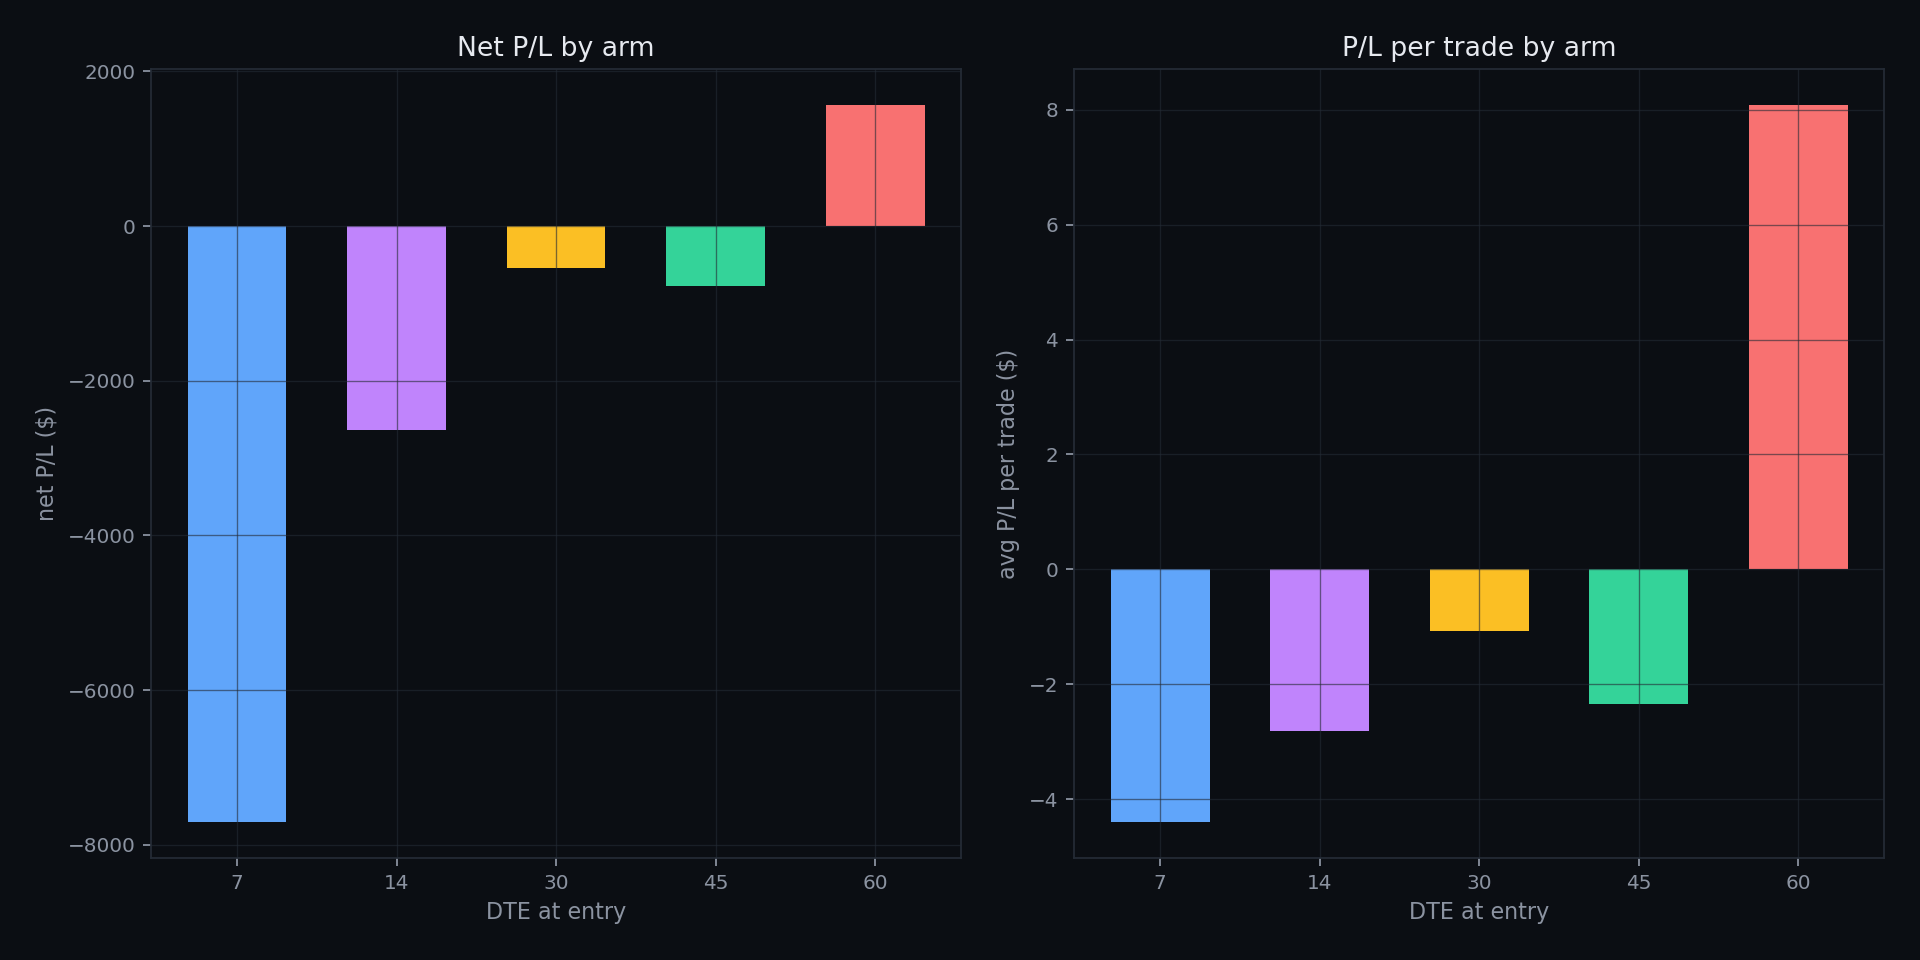
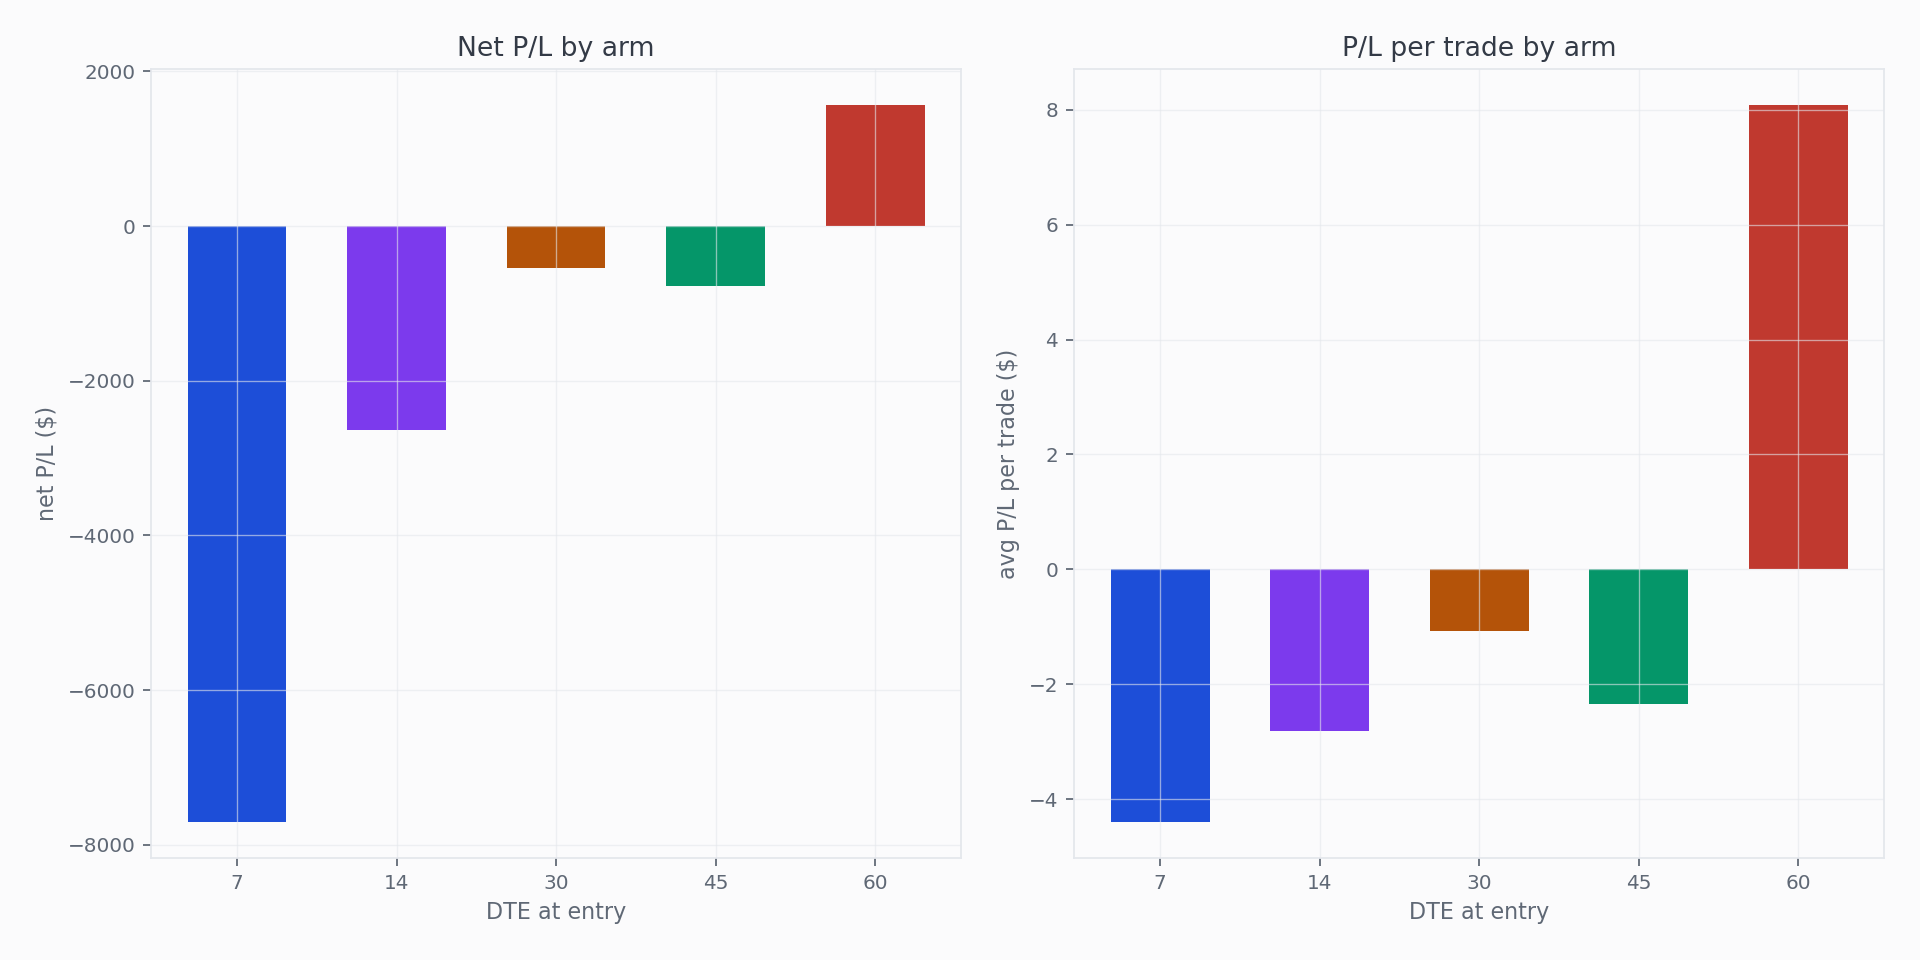
Under the midpoint fills of our earlier revision, net P/L descended as DTE rose — the fast arms piled up the most dollars. Realistic fills invert that outright: every arm except the 60-DTE loses money, and the loss grows with trading frequency. The 7-DTE arm crossed the spread 1,751 times and paid for every crossing. The optimistic column shows what the midpoint model would still like you to believe.
| Arm | Trades | Win rate | Net P/L (realistic) | Net P/L (mid) | Avg/trade | Avg win | Avg loss | Max DD |
|---|---|---|---|---|---|---|---|---|
| 7 DTE | 1,751 | 69.6% | −$7,708 | +$9,680 | −$4.40 | +$32.41 | −$88.53 | −$8,894 |
| 14 DTE | 936 | 71.5% | −$2,643 | +$6,947 | −$2.82 | +$37.17 | −$103.04 | −$3,958 |
| 30 DTE | 499 | 69.5% | −$540 | +$4,952 | −$1.08 | +$41.40 | −$98.06 | −$1,959 |
| 45 DTE | 331 | 70.7% | −$776 | +$3,148 | −$2.34 | +$43.41 | −$112.71 | −$1,881 |
| 60 DTE | 194 | 74.7% | +$1,569 | +$3,435 | +$8.09 | +$45.41 | −$102.36 | −$730 |
Realistic fills (0.66 of the spread per leg), no commissions; the mid column prices the same trades at the pure mid · one position at a time, so trade counts differ by arm — and shift slightly between revisions because exits now trigger on slipped values · far-dated arms skip more days simply because a suitable expiration wasn’t listed (the 60-arm found no usable spread on 667 entry days) · 24 of the 45-arm’s 1,334 leg fills had no two-sided closing quote and used the last trade.
What the rule actually buys you
Our previous revision ended by warning that real fills would “bite hardest exactly where trades are most frequent and the per-trade edge is thinnest.” This revision prices that bite, and it is the whole result. The per-trade edge at the midpoint was $5–18 across the arms; the cost of crossing 0.66 of a SPY spread twice per trade runs about $10–15. Every arm whose midpoint edge was thinner than its spread toll went negative, in exact frequency order. Only the 60-arm — the biggest per-trade edge, the fewest crossings — kept a positive number, and it also kept the best win rate and the smallest drawdown.
The folklore emerges strengthened and simplified: longer DTE doesn’t maximize dollars at the midpoint; under realistic execution it is the only thing that leaves you any dollars at all. The 45-arm — the classic rule reproduced exactly — finished second-best and still slightly negative in this window; the step from 45 to 60 was the step across zero. Trade less, keep more.
What this does not show
These are hypothetical, simulated results on historical data, filled under the engine’s disclosed execution model with no commissions or assignment costs. They are not a record of trading, and past behavior does not indicate future behavior. A single underlying over a single window is one sample — SPY spent most of 2013–2025 in an uptrend, which favors put-side premium selling in ways that will not generalize. The slip fraction itself is a model: 0.66 of the spread is a published industry convention, not a law — your fills sit somewhere in the band between the two columns above, and where depends on order type, size, and patience.
The trade counts also differ by arm, which means the arms are not equally exposed to any given month. A 60-DTE position occupies the engine for longer, so it declines more entry opportunities. Comparing on net P/L rewards the arm that happened to be in the market during favorable stretches; comparing on per-trade averages rewards the arm that trades least. Both columns are above, deliberately.
Reproducing this
Every arm is a saved strategy with two fields changed. Create a put credit spread on SPY, set the short strike to 0.30 delta and the width to $5, the profit target to 50% of credit, the stop to 200% — then run it once per arm with DTE 7/14/30/45/60, time exit at half the DTE (4/7/15/21/30), daily entries, and the window 2013-04-01 through 2025-12-31.