Iron condors through the 2020 and 2022 drawdowns
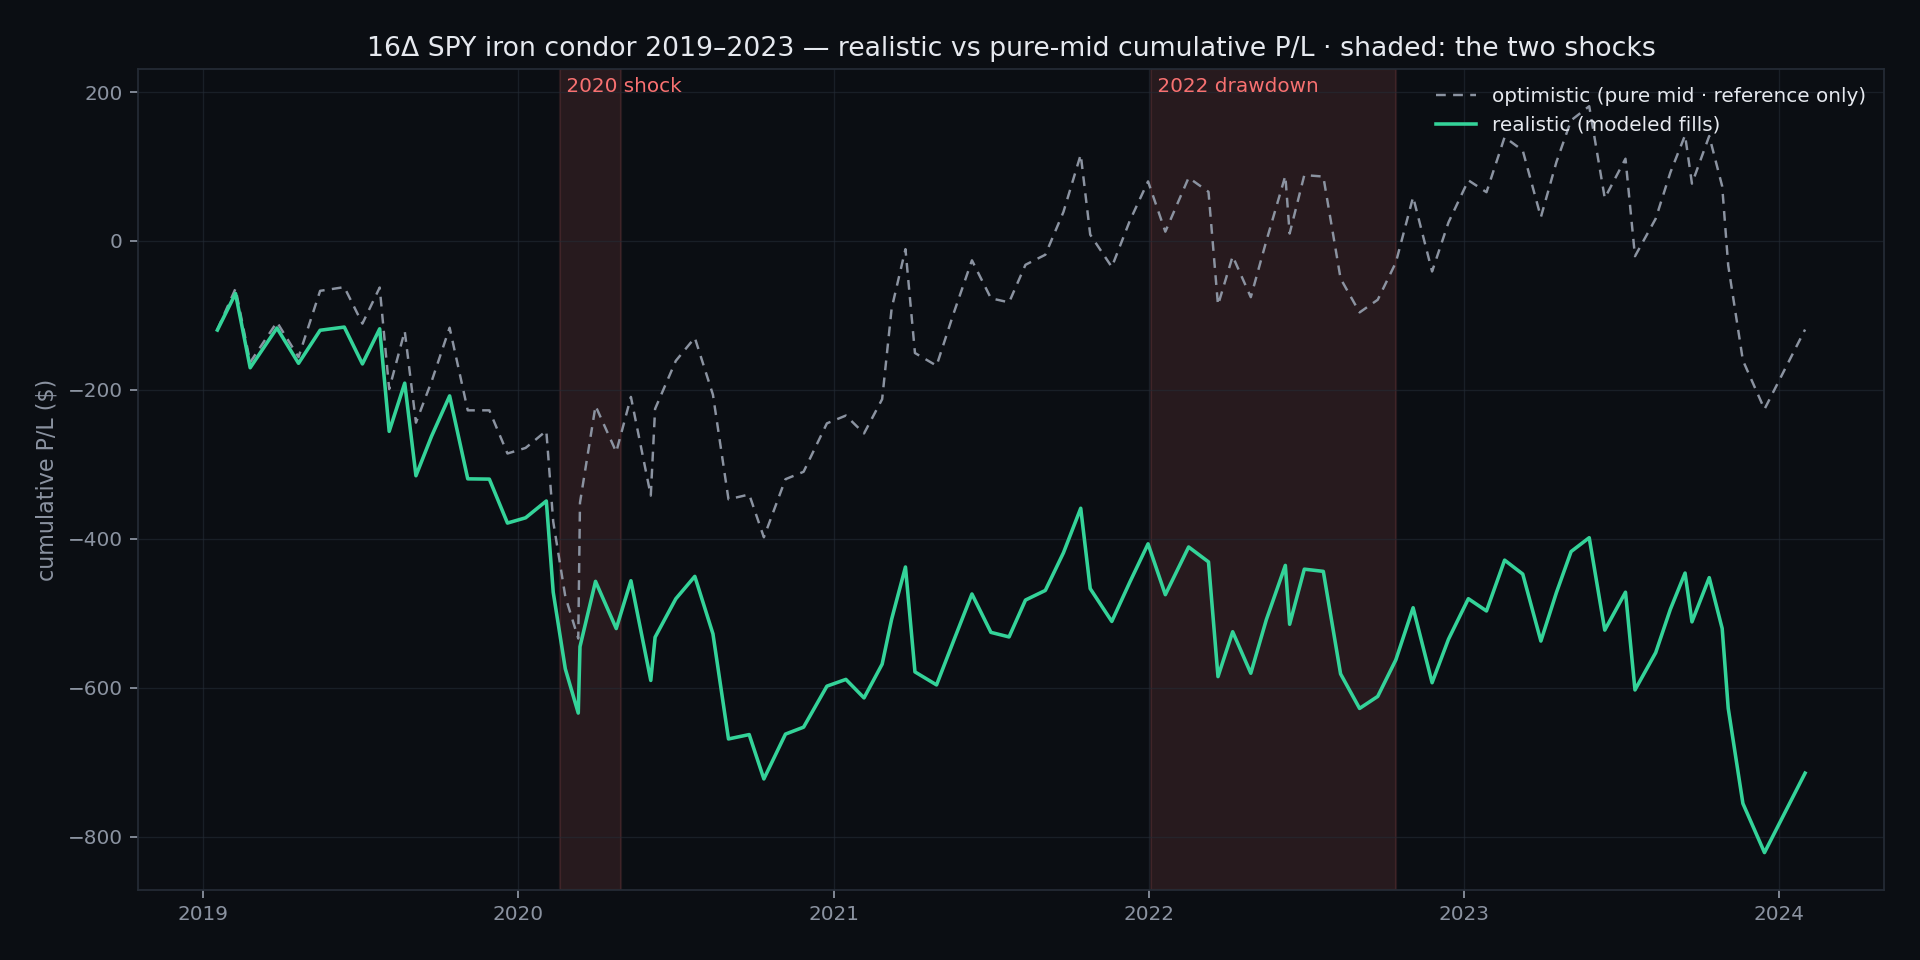
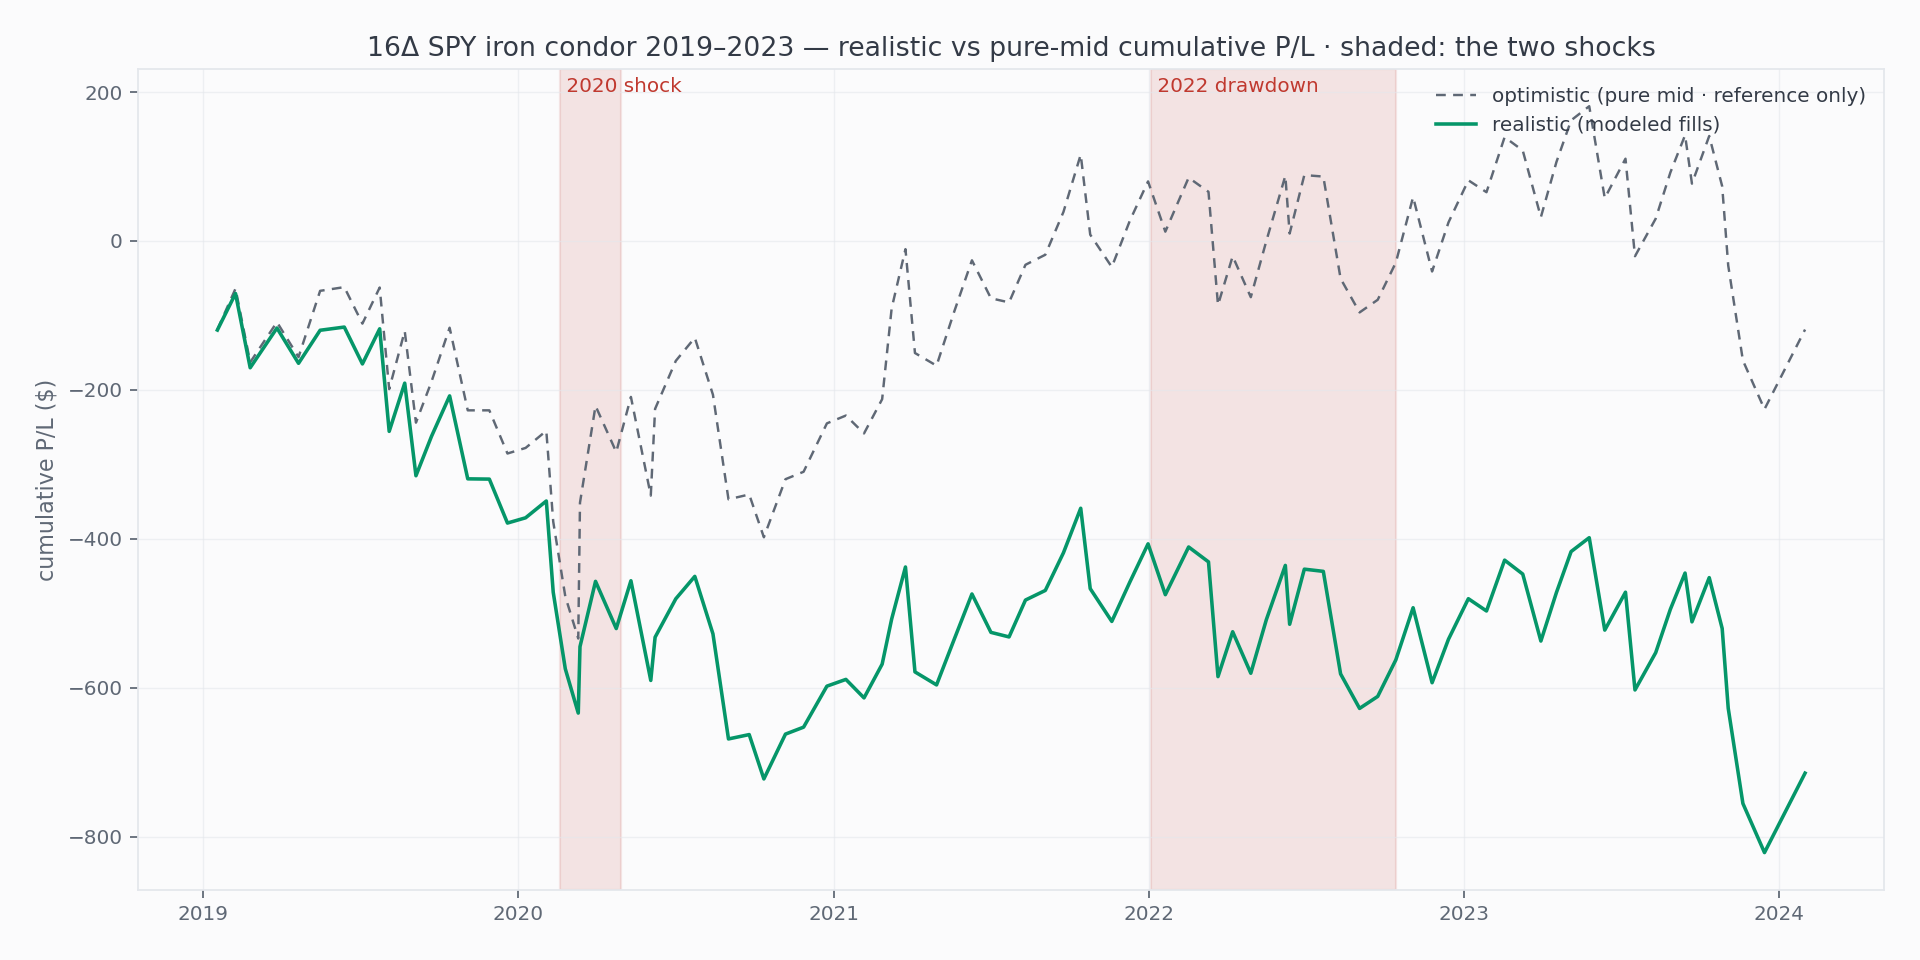
A 16-delta SPY condor run continuously through 2019–2023 finished with a 54.7% win rate and a realistic net of −$715 across 95 trades — −$119 even at pure-midpoint fills. Four legs of spread toll settle the verdict the midpoint model left ambiguous. The average still hides the shape: two volatility shocks did very different kinds of damage.
The iron condor's pitch is symmetry: sell both tails, collect both premiums, profit when nothing much happens. The honest question is what happens when something does — and 2019–2023 contains two very different versions of something: the February–April 2020 crash (fast, violent, quickly recovered) and the 2022 bear market (slow, grinding, ten months long).
Updated Aug 23, 2026 — Re-run under engine rev 3 — figures now include modeled fills. Tables show realistic (slipped fills — the headline) and optimistic (pure mid · reference only). See the methodology. This study also gains rev 3’s intraday breach evaluation — the condor’s short-strike and wing rules now test the day’s high and low per side, so several exits moved 1–4 days earlier.
We ran one condor configuration straight through all five years, no regime timing, no pausing: 16-delta short strikes on both sides, $5 wings, 45 DTE, managed at 21 — the standard "wings-and-patience" recipe.
Method
- Structure: SPY iron condor, both short strikes targeted at 0.16 delta, $5 wings both sides, one contract.
- Exits: 50% of credit profit target, 200% stop, time exit at 21 DTE — first to fire closes the whole position.
- Entries: attempted daily, one position at a time, January 2019 through December 2023.
- Fills: per-leg spread-fraction slippage at the four-leg default (each leg fills 0.53 of the way across its closing bid/ask), no commissions. Breach rules evaluate the day’s intraday high/low per side.
End-of-day by design: like every OptionKrafter backtest, this study runs on daily bars — the resolution that keeps years of history reproducible and matches how rule-based options strategies actually trade — with full daily OHLC on the underlying, spread-priced fills on every leg, and both the realistic and pure-mid figure reported. Run under engine rev 3 (end-of-day). Windows from Apr 2023 now evaluate minute by minute; this study has not been re-run. How the engine models fills →
Results
| Metric | Value |
|---|---|
| Trades | 95 |
| Win rate | 54.7% |
| Net P/L (realistic) | −$715 |
| Net P/L (mid) | −$119 |
| Average per trade | −$7.52 |
| Average win / loss | +$51.30 / −$78.67 |
| Max drawdown | −$821 |
Realistic fills (0.53 of the spread per leg), no commissions · 26 entry days found no suitable expiration and 11 found no usable four-leg chain — counted, not traded · 16 of 760 leg fills had no two-sided closing quote and used the last trade.
Five years of continuous premium selling through two major shocks produced a realistic net of −$715 — and even the pure-midpoint model, which flatters every fill, could only get it to −$119. Under midpoint fills this strategy was arguably break-even; pricing four legs of execution settles it. The loss asymmetry (−$79 average loss vs +$51 average win) is the condor's arithmetic — it wins often and loses bigger — and the four-leg spread toll of roughly $6 per round trip is the margin between “almost” and “no”. Over a window containing 2020 and 2022, “often” did not cover “bigger”, and it never got to keep the difference anyway.
The two shocks were not the same trade
The 2020 crash was fast enough that only a handful of positions were exposed — the damage was concentrated and then over; the strategy resumed collecting within weeks. The 2022 bear was the opposite: no single catastrophic day, but ten months of elevated volatility and trending price meant repeated stop-outs on the put side — a slow bleed rather than a wound. On the chart, 2020 is a cliff; 2022 is a staircase down. Averages over the full window see neither.
What this does not show
These are hypothetical, simulated results on historical data, filled under the engine’s disclosed execution model with no commissions or assignment costs. They are not a record of trading, and past behavior does not indicate future behavior. One underlying, one configuration, one five-year window is one sample — and a sample chosen because it contains two shocks, which biases against the strategy relative to a calmer stretch. A 16-delta condor is one point on a wide spectrum; wider wings, further strikes, or regime filters are different strategies, not refinements of this one.
Reproducing this
Create an iron condor on SPY: both short strikes at 0.16 delta, $5 wings, 45 DTE, profit target 50% of credit, stop 200%, time exit 21 DTE, daily entries, window 2019-01-01 through 2023-12-31.