Earnings weeks: the premium and the price
Twelve years of put credit spreads on AAPL and MSFT, split by whether the position spanned an earnings report. At midpoint fills the spanning trades still paid slightly more, and the feared blow-ups still mostly didn't come — but under realistic fills every population on both names is under water. On single names, the tax that matters isn't the earnings gap; it's the spread you cross to play.
Selling premium into earnings is supposed to be a devil's bargain: the IV crush pays you more per trade, and the gap risk takes it back on the quarters that go wrong. Folklore usually stops there. We wanted the split actually measured — same strategy, same names, trades divided only by whether an earnings announcement fell inside the holding window.
Updated Aug 23, 2026 — Re-run under engine rev 3 — figures now include modeled fills. Tables show realistic (slipped fills — the headline) and optimistic (pure mid · reference only). See the methodology.
Method
- Strategies: 0.30Δ put credit spreads, $5 wide, 30 DTE managed at 15, daily entries, one position at a time — run separately on AAPL and MSFT, January 2014 through December 2025.
- Earnings dates: from SEC 8-K filings flagged as earnings releases, using the filing's acceptance timestamp — a release accepted after the close counts against the next trading session, when its price reaction actually lands. AAPL contributes 49 events (48 quarterly reports plus the January 2019 revenue-warning 8-K, which was an earnings disclosure in every sense that matters to a position); MSFT contributes 48.
- The split: a trade "spans earnings" if the reaction session falls between its entry and exit dates, inclusive. No other difference — the engine never saw the earnings calendar; the split is applied to its trade records afterward.
End-of-day by design: like every OptionKrafter backtest, this study runs on daily bars — the resolution that keeps years of history reproducible and matches how rule-based options strategies actually trade — with full daily OHLC on the underlying, spread-priced fills on every leg, and both the realistic and pure-mid figure reported. Run under engine rev 3 (end-of-day). Windows from Apr 2023 now evaluate minute by minute; this study has not been re-run. How the engine models fills →
Results
| Population | Trades | Win rate | Avg/trade (realistic) | Avg/trade (mid) | Net (realistic) | Net (mid) | Avg win | Avg loss |
|---|---|---|---|---|---|---|---|---|
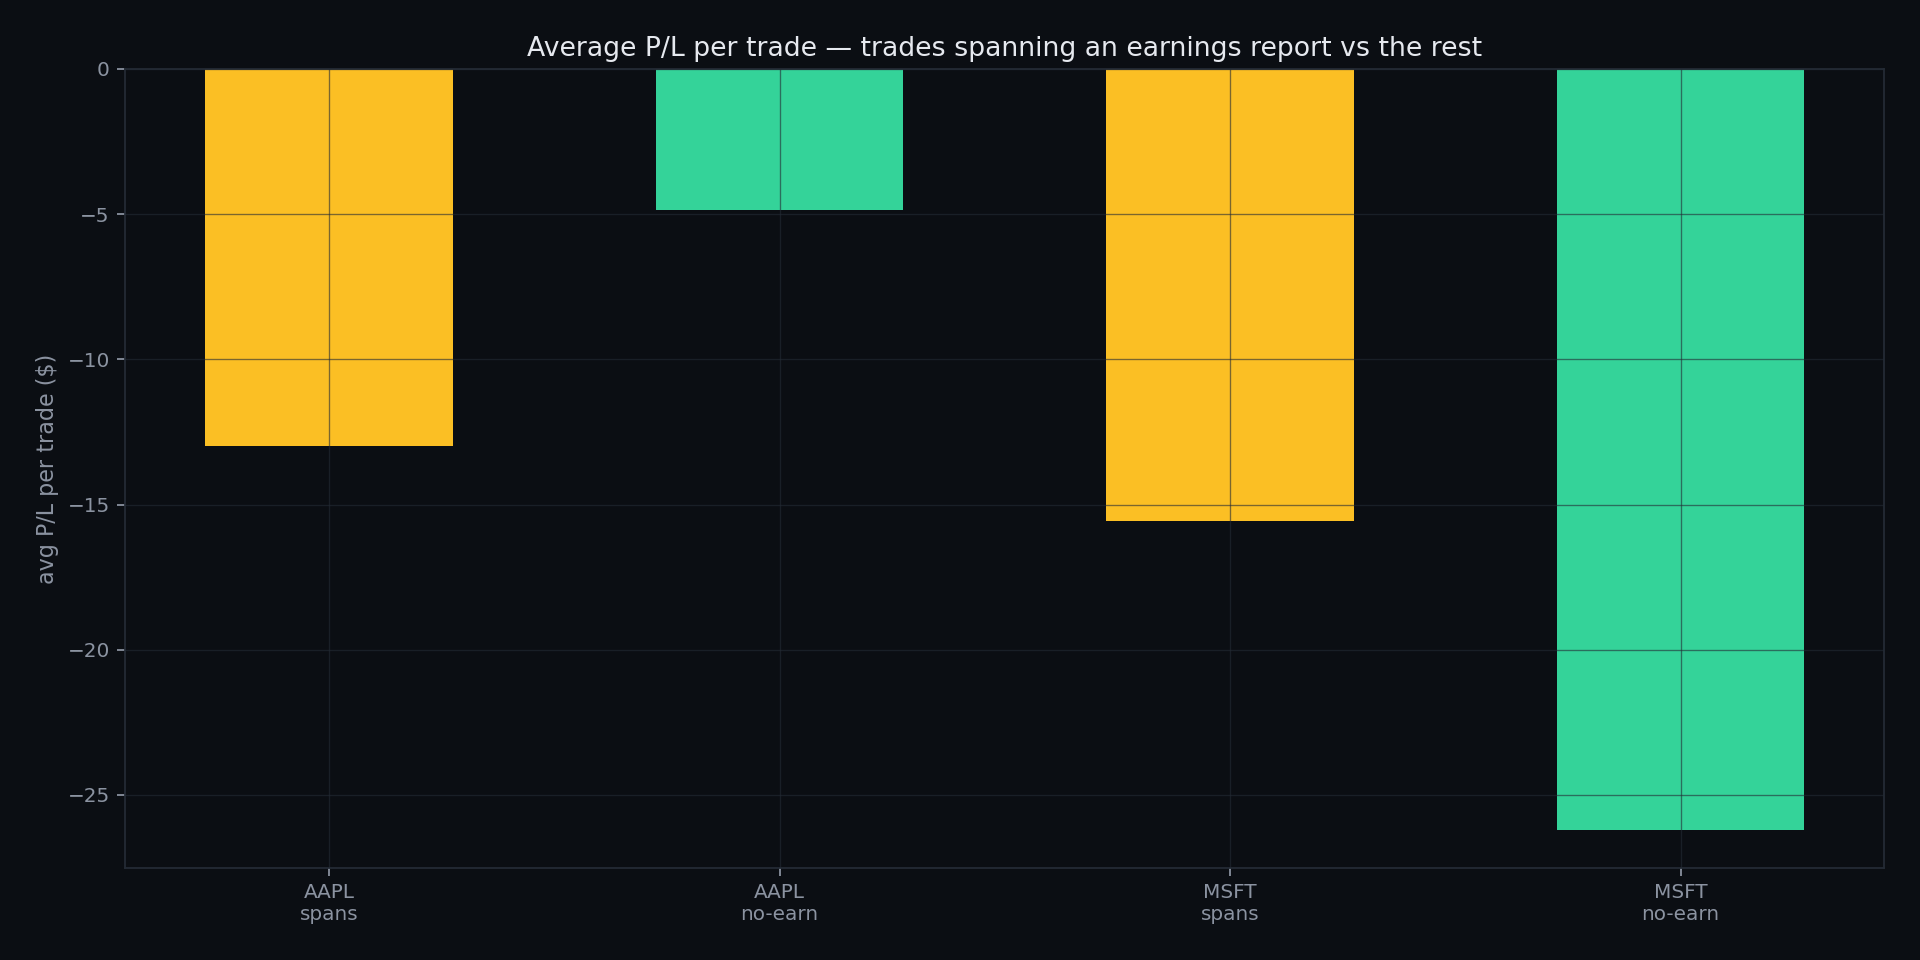
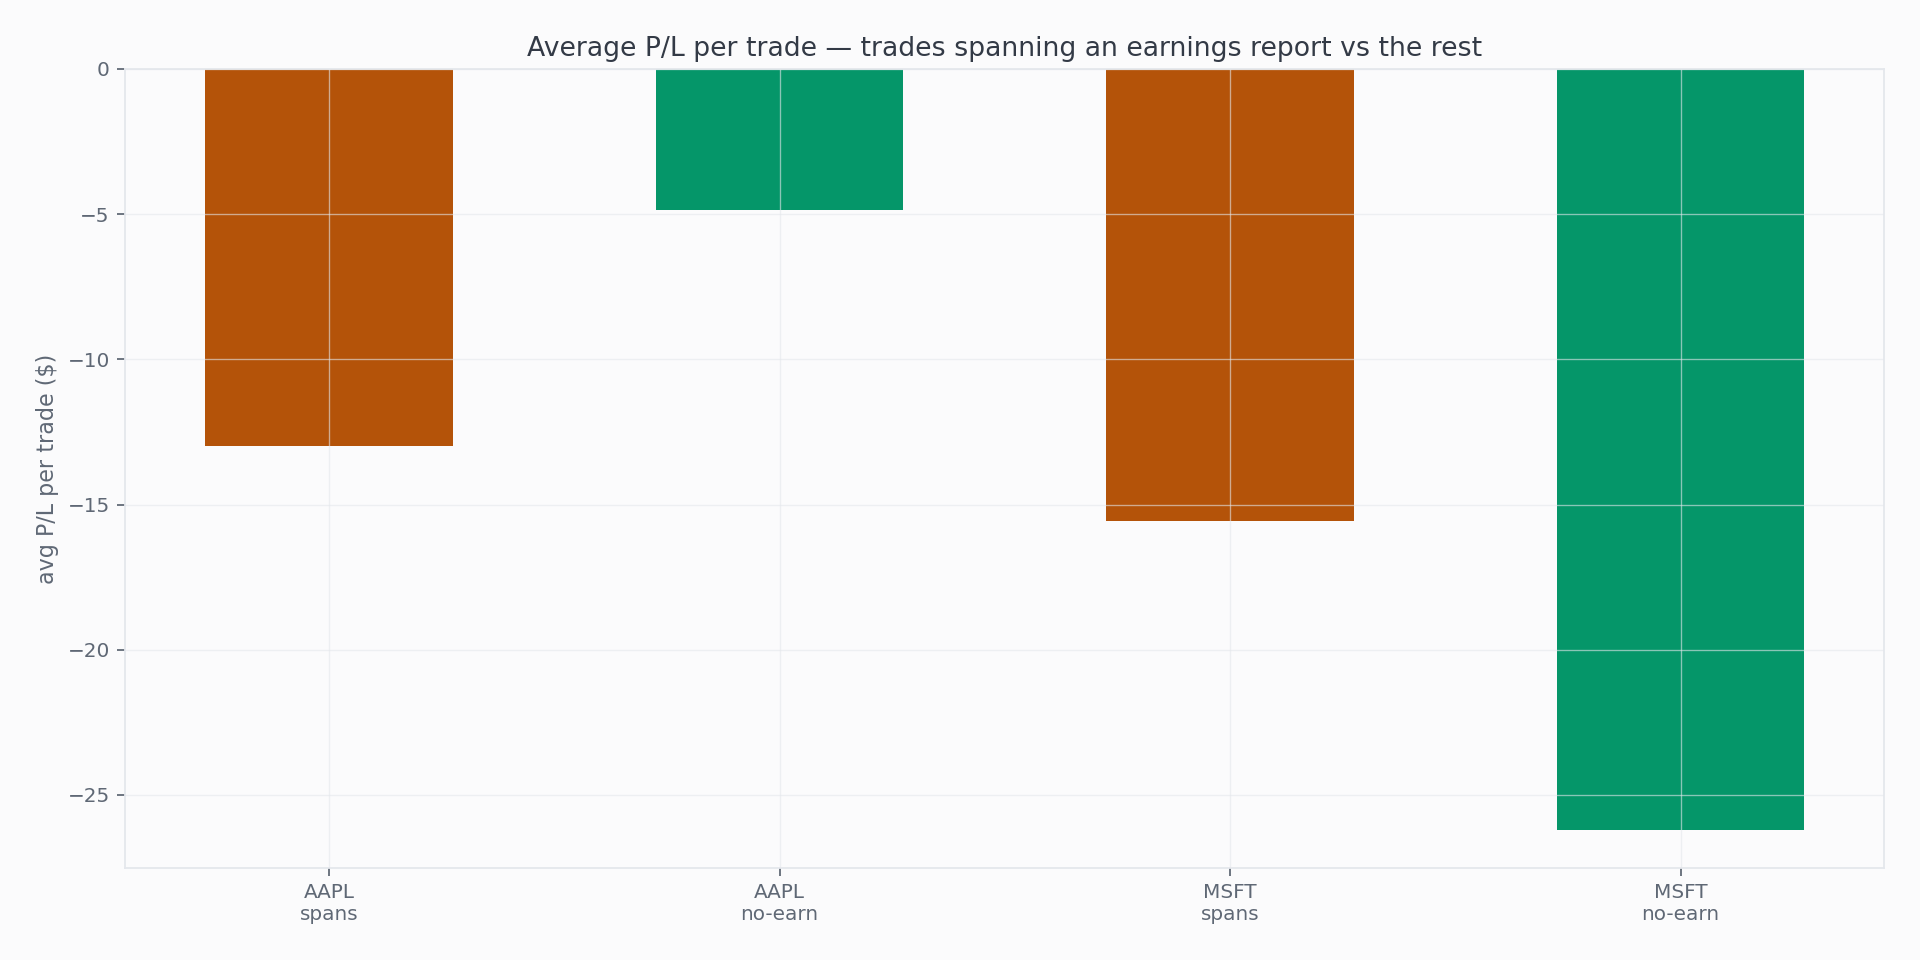
| AAPL · spans earnings | 75 | 65.3% | −$12.99 | +$13.70 | −$974 | +$1,028 | +$52.64 | −$136.67 |
| AAPL · no earnings | 420 | 65.5% | −$4.85 | +$12.46 | −$2,035 | +$5,235 | +$55.95 | −$120.15 |
| MSFT · spans earnings | 77 | 61.0% | −$15.56 | +$19.47 | −$1,198 | +$1,500 | +$41.54 | −$105.00 |
| MSFT · no earnings | 488 | 57.8% | −$26.20 | +$4.65 | −$12,785 | +$2,270 | +$39.28 | −$115.83 |
Realistic fills (0.66 of the spread per leg), no commissions; the mid columns price the same trades at the pure mid · the populations share every parameter; only the calendar differs · trade counts shift slightly between revisions because exits trigger on slipped values.
Where did the blow-ups go?
Both halves of the original finding survive — in the optimistic column. At midpoint pricing the spanning trades still out-earn the quiet ones on both names (+$13.70 vs +$12.46 on AAPL, +$19.47 vs +$4.65 on MSFT), and the loss populations still look nothing like catastrophe: average losses run $105–137 on defined-risk spreads whose maximum is bounded by the wings, with no categorical difference between the spanning and quiet sides. Twelve years of quarterly reports on two of the most-watched names produced no blow-up population.
What realistic fills add is a blunter fact: every population is negative once you pay the spread. AAPL and MSFT single-name spreads are wider than SPY’s, and 0.66 of that width taken twice per trade costs more than either population’s midpoint edge. The earnings question this study set out to answer turns out to be the smaller of the two costs on the table.
The explanation isn't that earnings gaps stopped happening — it's the structure. A defined-risk spread caps what a gap can do: the $5 wings mean the worst earnings surprise and the worst quiet-market slide cost the same bounded amount. The trades that blow through a short strike on earnings morning land on the long strike, exactly as designed. An undefined-risk version of this study — naked puts, straddles — would tell a very different story, which is precisely why it's a different strategy.
What this does not show
These are hypothetical, simulated results on historical data, filled under the engine’s disclosed execution model with no commissions or assignment costs. They are not a record of trading, and past behavior does not indicate future behavior. Two mega-caps are a deliberately benign sample: AAPL and MSFT gap smaller than high-beta single names, and 75 spanning trades per name carries wide error bars. This study also ran at end-of-day granularity — its window reaches before April 2023, where daily data is the engine’s resolution (windows from April 2023 onward evaluate minute by minute) — and end-of-day can’t see the intraday path — a position that survived earnings morning by noon and was stopped at the close is recorded only by its exit. Treat the result as "the wings held, here" — not "earnings risk is free."
Reproducing this
Create a put credit spread on AAPL (and again on MSFT): 0.30Δ short strike, $5 wide, 30 DTE, PT 50%, stop 200%, time exit 15, daily entries, window 2014-01-01 → 2025-12-31. The earnings split uses the SEC's earnings-flagged 8-K acceptance timestamps, shifted to the next session for after-close releases.