We played every NVDA earnings since 2016. All six strategies lost.
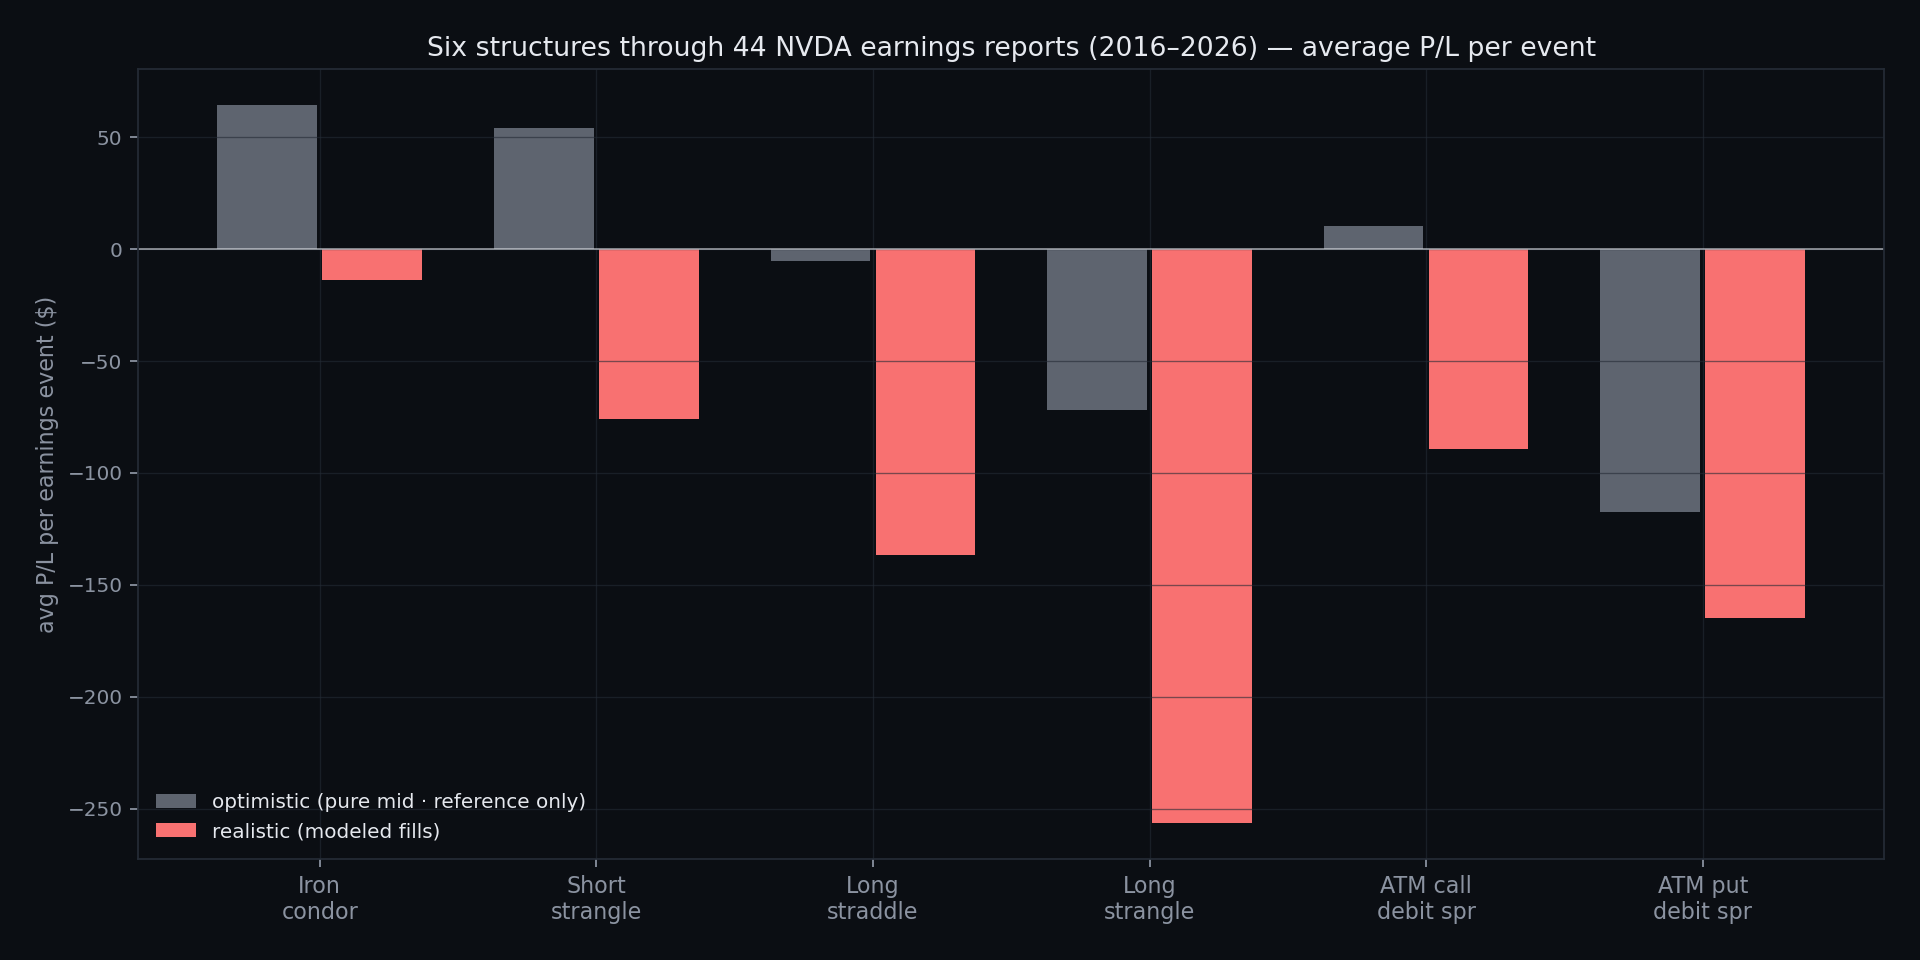
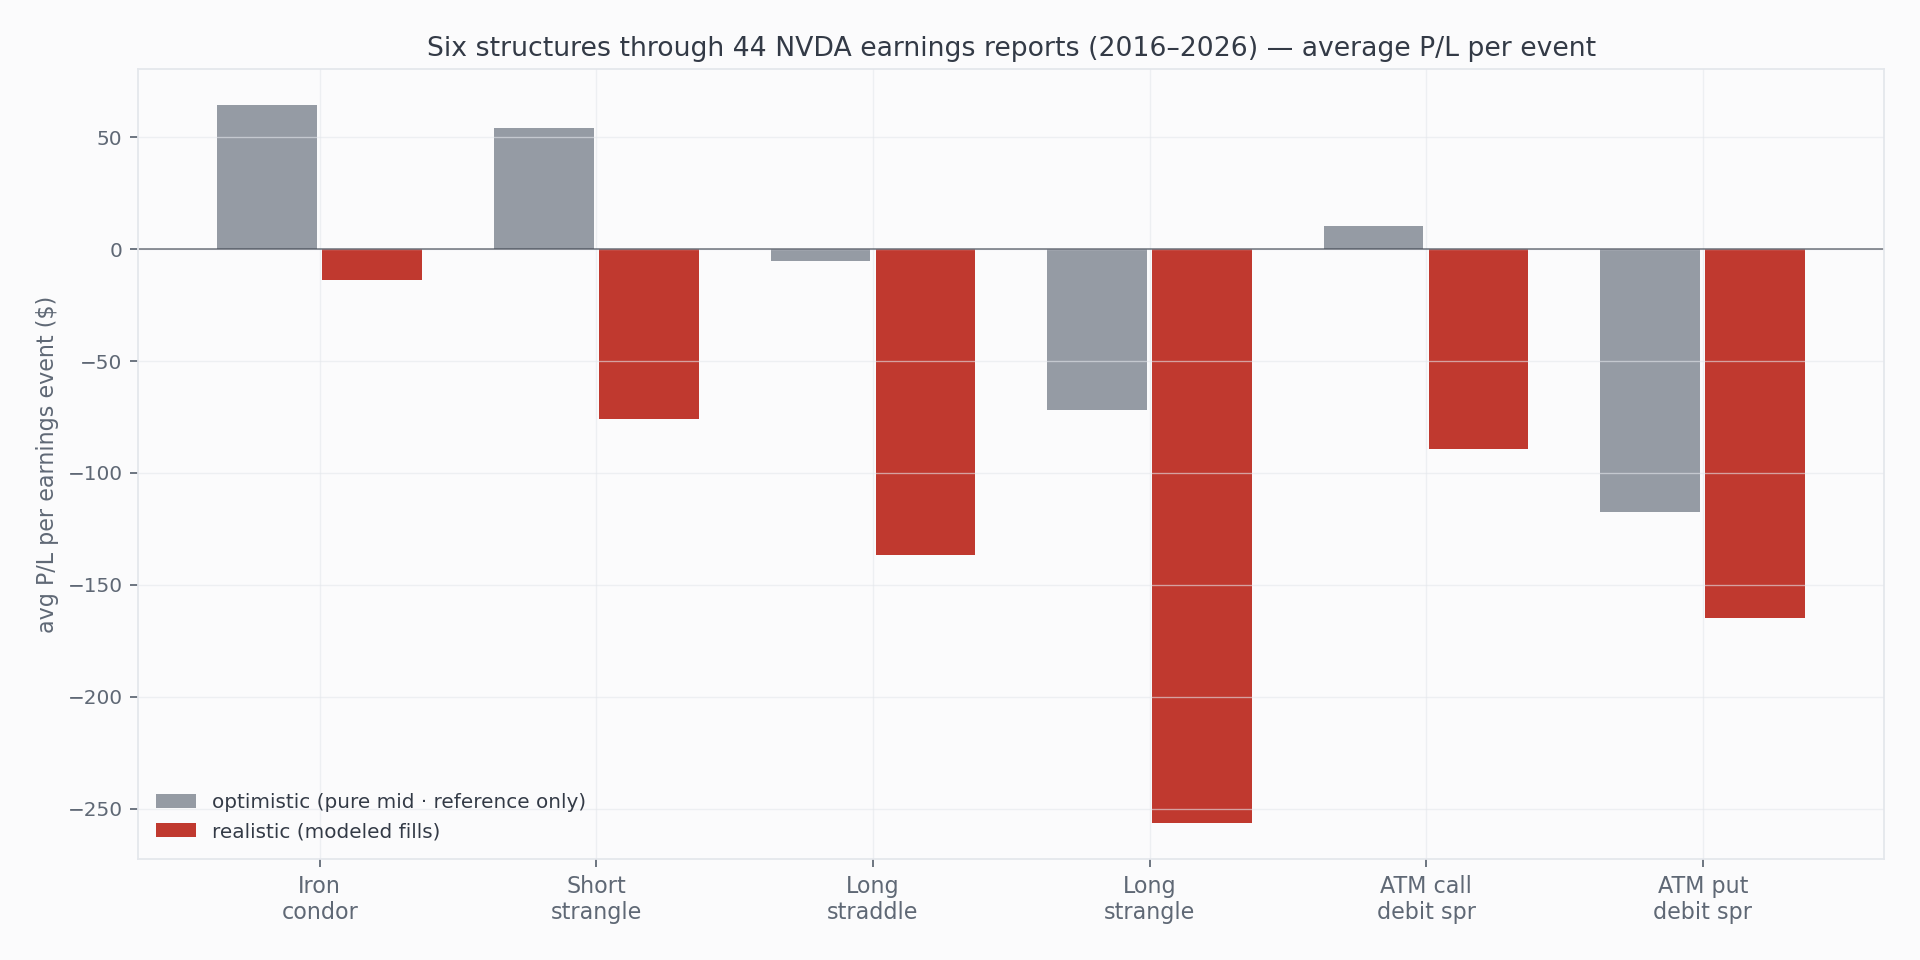
Enter at the close before the report, hold through the reaction, manage with standard rules: six option structures, 44 earnings events, 251 positions. Under realistic fills every structure finished negative — including an iron condor that won 80% of the time — and the two short-volatility structures that looked profitable at textbook midpoint pricing flipped when the spread was paid.
NVIDIA reports earnings this week, and the folklore machine is running: sell the inflated premium, or buy the breakout before it happens. Both camps sound convincing. So we did what this site exists to do — ran the actual play, every quarter, for a decade, and priced the fills honestly.
Method
- The play: enter at the close on the day before each report lands (NVDA reports after the close, so the position is on hours before the news), hold through the reaction session, exit by rule.
- Events: all 44 NVDA earnings reports Feb 2016 – May 2026, with reaction dates derived from SEC 8-K filings flagged as earnings releases — a release accepted after the close counts against the next trading session.
- Six structures, one per event: 16Δ iron condor · 16Δ short strangle · ATM long straddle · 25Δ long strangle · ATM call debit spread · ATM put debit spread. Weekly expirations (the first expiry after the reaction — usually the Friday one or two sessions out).
- Management live throughout: credit structures take profit at 50% of credit and stop at 2× credit; debit structures take profit at +100% and stop at −50%. A stop-out on reaction day is a real, earlier exit — that is the play’s actual risk management, not a technicality.
- Wings scale with the stock: NVDA’s as-traded price ran from ~$25 to ~$950 across two splits, so condor and debit-spread widths are set at roughly 5% of spot on the listed strike grid per era ($2.50 wings in 2016 up to $50 at the 2023 peak). Delta-targeted legs need no adjustment — delta is split-immune.
- 13 of 264 event-positions (5%) never held through a reaction — mostly early-era weekly-expiration gaps — and are excluded and counted, not filled in.
End-of-day by design: like every OptionKrafter backtest, this study runs on daily bars — the resolution that keeps years of history reproducible and matches how rule-based options strategies actually trade — with full daily OHLC on the underlying, spread-priced fills on every leg, and both the realistic and pure-mid figure reported. Run under engine rev 3 (end-of-day). Windows from Apr 2023 now evaluate minute by minute; this study has not been re-run. How the engine models fills →
Results
| Structure | Events | Win rate | Avg P/L (realistic) | Avg (mid) | Total (realistic) | Total (mid) | Max DD (realistic) |
|---|---|---|---|---|---|---|---|
| Iron condor 16Δ | 41 | 80.5% | −$13.70 | +$64.52 | −$562 | +$2,646 | −$1,995 |
| Short strangle 16Δ | 42 | 78.6% | −$75.93 | +$54.37 | −$3,189 | +$2,284 | −$5,443 |
| Long straddle ATM | 42 | 35.7% | −$136.79 | −$5.21 | −$5,745 | −$219 | −$10,481 |
| Long strangle 25Δ | 42 | 31.0% | −$256.62 | −$71.81 | −$10,778 | −$3,016 | −$12,263 |
| ATM call debit spread | 42 | 40.5% | −$89.34 | +$10.35 | −$3,752 | +$435 | −$5,678 |
| ATM put debit spread | 42 | 35.7% | −$164.71 | −$117.39 | −$6,918 | −$4,931 | −$8,575 |
One contract per event · expectancy per event equals the avg P/L column · max drawdown is the deepest dip of the cumulative per-event equity across the decade, in the real contract dollars of each era · realistic = per-leg spread-fraction fills; mid = the same trades at pure mid (reference only).
The 80% winner that loses
The iron condor is the study’s sharpest lesson. It won 80.5% of its 41 events — the short strikes held through most reactions, exactly as the premium sellers promise. And it still lost money, because the arithmetic of the trade never survived contact with execution: four legs of spread toll at entry, more on the managed exits, small wins, occasional wing-tests. At pure mid pricing the same 41 positions made +$2,646; paying the spread turned an 80% win rate into realistic −$562 (optimistic +$2,646). The short strangle tells the same story with more violence on the losing tail.
Buying the move fails even before the spread
The long structures don’t need the fill model to lose. The ATM straddle averaged −$5.21 per event at the midpoint — the textbook IV-crush result: the options price in the move beforehand, the crush takes out what the gap pays, and the buyer needs an outsized surprise just to break even. Realistic fills then widen the loss to −$137 per event, because straddles cross two spreads on wide earnings-week markets. The 25Δ long strangle — cheaper premium, further strikes — was the worst structure in the study on every measure.
The reaction day decides
Of 251 positions, 212 exited on the reaction session itself — profit targets and stops firing at that day’s close — and 37 more settled at the next day’s weekly expiry. The play is genuinely a one-to-two-day trade: whatever the report does, the rules resolve it almost immediately. Exit reasons split as the structures suggest: the condor mostly took profits (32 of 41) with nine breach exits; the long strangle mostly stopped out (28 of 42).
What this does not show
These are hypothetical, simulated results on historical data, filled under the engine’s disclosed execution model with no commissions or assignment costs. They are not a record of trading, and past behavior does not indicate future behavior. One underlying is one sample — NVDA spent this decade mostly going up, which flatters nothing here but shapes everything. Forty-something events per structure carries wide error bars; a couple of different reactions would move every average. This study ran at end-of-day granularity — its window reaches before April 2023, where daily data is the engine’s resolution (windows from April 2023 onward evaluate minute by minute) — and end-of-day cannot see the intraday path — a straddle that was briefly profitable at the open before the crush is recorded only by its close. Earnings-week spreads are wider than normal weeks, which is precisely why the realistic column diverges hardest here; your fills live somewhere in the band between the two columns. And none of this says anything about this Wednesday.
Reproducing this
Each structure is a saved strategy run over a one-week window per event: entry the trading day before the reaction, DTE 3 (snapping to the first weekly after the report), profit target and stop as listed in Method, daily entries, one position at a time. The per-event windows come from SEC 8-K acceptance timestamps; the era wing table is in Method. Build the same strategies in OptionKrafter and run any event window — the run page shows both figures and the assumptions stamped.