What crossing the spread really costs: 28 million option quotes, 2011–2022
We measured the bid–ask spread on every candidate quote in our archive, then rebuilt our backtest engine so every simulated fill pays it. Median spreads narrowed roughly 2.5× since the mid-2010s; the thin-strike tail stayed brutally wide in every era — and when our own published studies were re-run under the new model, 12 of 22 changed sign.
Almost every options backtest you will ever see — ours included, until August 2026 — fills simulated trades at the midpoint of the closing bid and ask. It is a defensible convention and a flattering one: no live order gets the midpoint reliably, and the gap between mid and reality compounds per leg, per trade, forever. The criticism that a mid-fill backtest is "a model of a market where trading is free" is fair. We decided to measure exactly what free was hiding.
What we measured
Our historical warehouse holds end-of-day option chains from January 2008 — 3.96 billion rows. For every candidate quote on ten liquid names (SPY, QQQ, IWM, AAPL, MSFT, NVDA, TSLA, AMZN, GOOGL, META) with 0–60 days to expiration, we asked two questions: does the row carry a real two-sided quote at all, and if so, how wide is the spread relative to the option's price? That is roughly 28 million two-sided quotes across 2011–2022, sampled at 20% for the percentile statistics.
Two findings
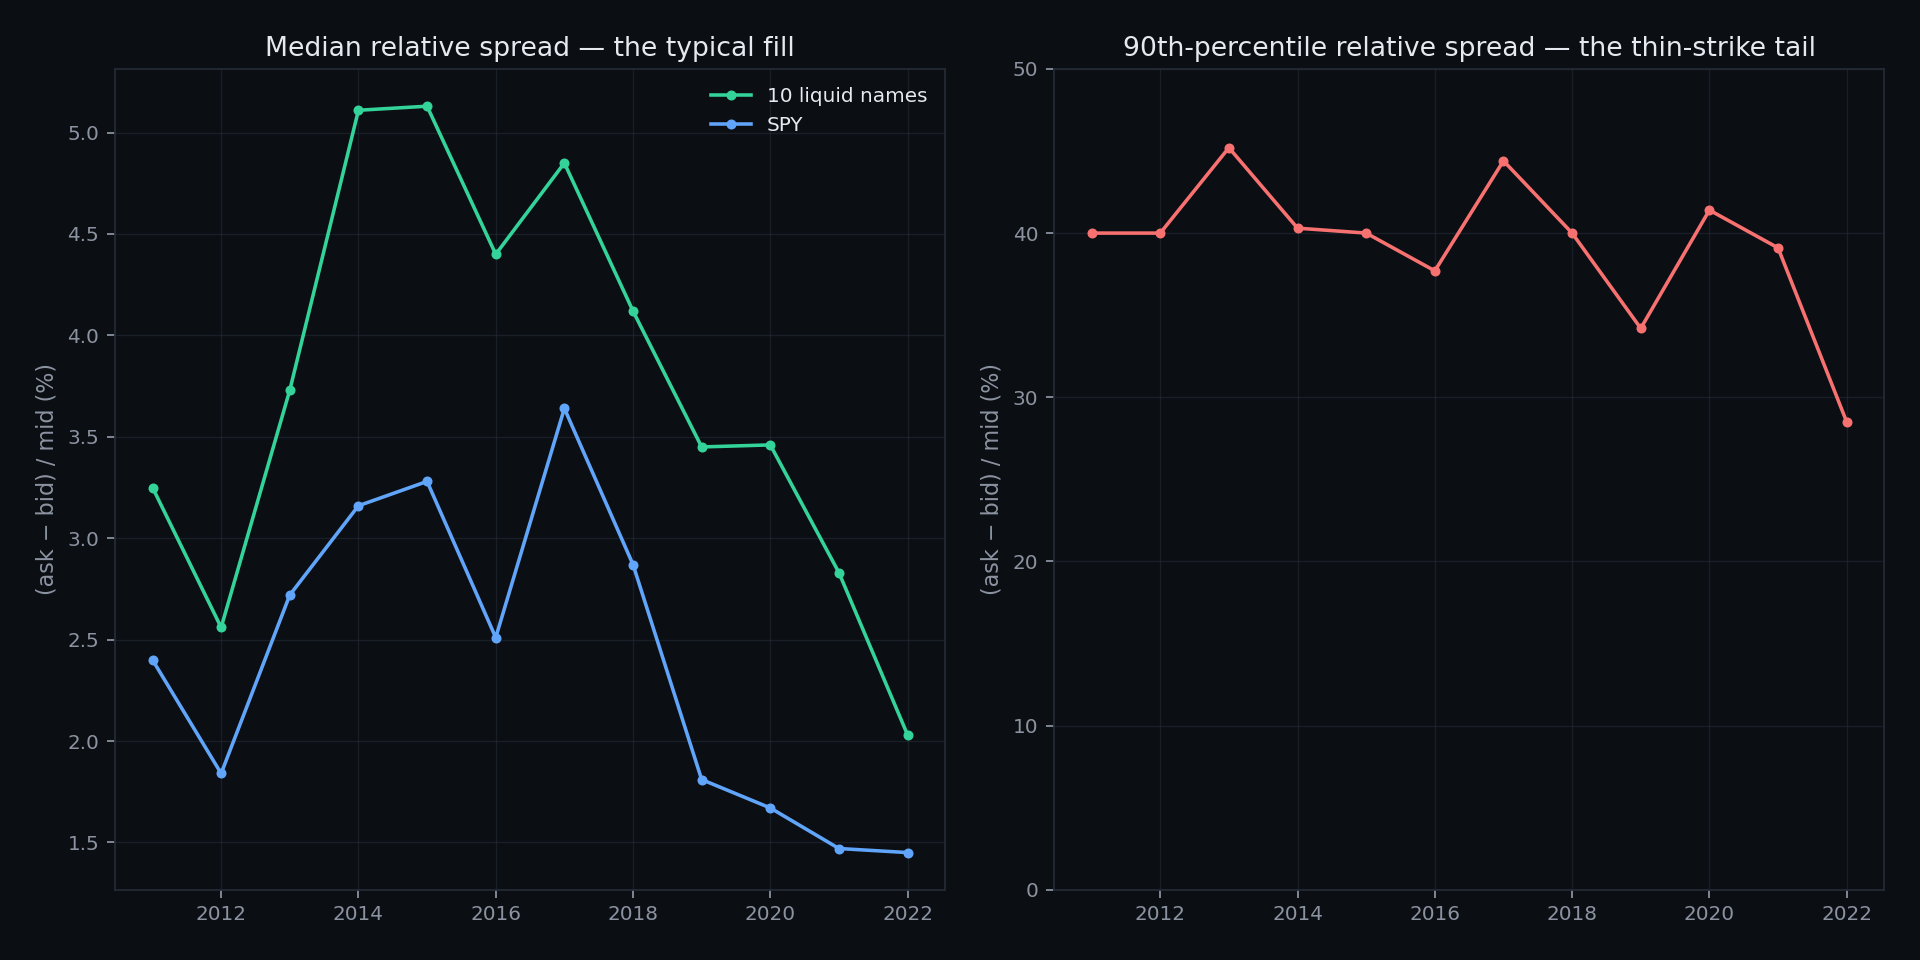
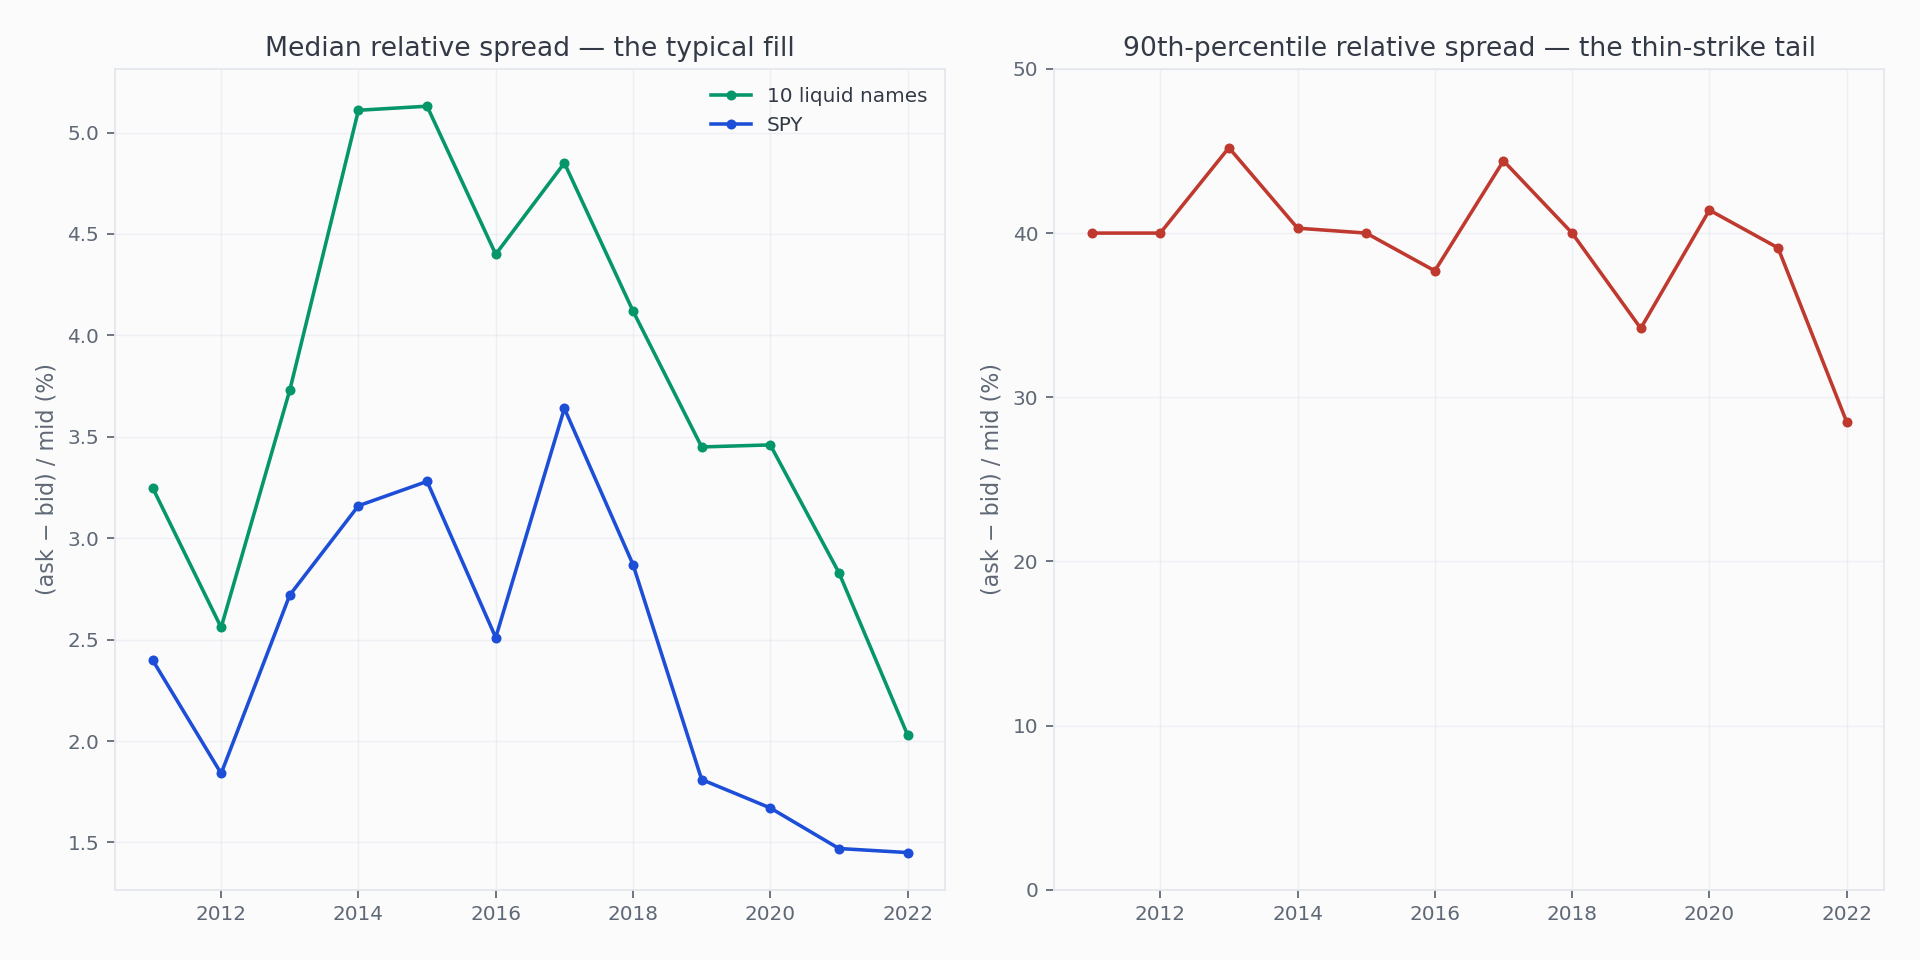
Spreads narrowed about 2.5×. The median relative spread across the ten names fell from roughly 5.1% of the option's price in 2014–2015 to about 2.0% in 2022; on SPY alone, from ~3.2% to ~1.45%. Options genuinely got cheaper to trade — a real, measurable market improvement, and a reason recent-era backtests transfer to live trading better than old ones.
The tail never did. The 90th-percentile spread sits between 28% and 45% of the option's price in every year of the archive. One quote in ten is a thin strike where crossing even part of the spread costs a third of the option's value. Delta-targeted entries land on these strikes more often than intuition suggests — the exact strike your rule wants is not always the liquid one. This is why a fill model has to work per leg, per day, from the actual quote: an average haircut would miss precisely the fills that hurt.
| Year | Two-sided coverage | Median rel. spread (10 names) | p90 | Median (SPY) |
|---|---|---|---|---|
| 2011 | 44% | 3.25% | 40.0% | 2.40% |
| 2013 | 78% | 3.73% | 45.2% | 2.72% |
| 2015 | 82% | 5.13% | 40.0% | 3.28% |
| 2017 | 82% | 4.85% | 44.4% | 3.64% |
| 2019 | 85% | 3.45% | 34.2% | 1.81% |
| 2021 | 86% | 2.83% | 39.1% | 1.47% |
| 2022 | 88% | 2.03% | 28.5% | 1.45% |
Ten liquid names, DTE 0–60, percentiles from a 20% sample of two-sided rows · full year-by-year series in the figure · 2008–2010 carry no two-sided quotes in the archive at all, and 2011 only partially — see below.
The fill model we adopted
Since August 2026, every OptionKrafter backtest prices each option leg a fraction of the way across that day's closing spread — a convention published and used across the options-backtesting industry:
- Buys fill at bid + (ask − bid) × slip; sells at ask − (ask − bid) × slip. A slip of 0.50 is exactly the midpoint; 1.00 crosses the whole spread.
- Defaults scale with leg count — multi-leg packages are quoted tighter than the sum of their legs; the exact ladder is in the table below. The fraction is configurable per strategy, and whatever value a run used is stamped on it.
- Every run reports two numbers. The headline is realistic (slipped fills, plus any configured commissions). Beside it, always, is optimistic — the same trades at pure mid, kept visible as a reference so the cost of execution is never hidden. Exits triggered by a profit target fill no better than the target level; stops keep the adverse close.
The fill model at a glance
| Parameter | Value |
|---|---|
| Resolution — Apr 2023 onward | 1 minute |
| Resolution — 2008 to Mar 2023 | end of day |
| Buy-leg fill | bid + (ask − bid) × slip |
| Sell-leg fill | ask − (ask − bid) × slip |
| Default slip, 1-leg strategies (wheel, long call/put) | 0.75 |
| Default slip, 2-leg (vertical spreads, straddles, strangles) | 0.66 |
| Default slip, 3-leg | 0.56 |
| Default slip, 4-leg (iron condor, iron butterfly) | 0.53 |
| Slip configurable per strategy | Yes — 0.00 to 1.00 (0.50 = pure mid) |
| Applied | Per leg, per day, from that day’s closing quote — entry and market exits; expiry settlement uncharged |
| No print in qualifying minute | entry skipped |
| Commissions | Configurable per contract, default $0.00, charged per transacted leg-side |
| No two-sided quote (all of 2008–2010, partial 2011) | Leg fills at last trade, never slipped, counted on the run page |
| Underlying data | Full daily OHLC, as-traded (unadjusted); the day’s high/low drive iron breach rules |
| Underlying minute path — before mid-2025 | derived from underlying prints carried on option quotes |
| Ticker coverage | All US tickers with traded options |
| Wheel | full cycle simulated (assignment, share holding, covered calls, call-away), cost-basis floor optional |
| Wheel resolution | end of day (v1) |
| Profit-target exits | Fill no better than the target threshold |
| Stop exits | Keep the adverse end-of-day value |
| Results shown | Realistic (slipped + commissions, the headline) and optimistic (pure mid, reference only) — always both |
| Assumptions | Stamped on every run (slip, commission, engine revision, data snapshot) |
Defaults follow a convention published and used across the options-backtesting industry; the surrounding model — dual reporting, per-run stamping, threshold-clamped exits, counted fallbacks — is OptionKrafter’s own.
The full specification — commissions, end-of-day stop semantics, engine revisions — lives on the methodology page, and each run's header links to it.
Resolution, and the two data eras
One engine, two data eras, and in each the finest resolution the data supports. Windows starting April 2023 or later evaluate minute by minute — automatically, on paid plans, with no setting to choose. Windows reaching earlier than that, and every wheel backtest (v1), evaluate end-of-day, exactly as described below. For the deep era — 2008 through March 2023 — the argument is unchanged:
For the deep era — 2008 through March 2023 — OptionKrafter is an end-of-day engine, by design (windows starting April 2023 or later evaluate minute by minute). Daily bars are what make eighteen years of option history tractable and every result reproducible; they match how rule-based options strategies are actually traded — entered and managed once a day, on rules, not on a screen watch; and they resist the curve-fitting that minute-by-minute noise invites. The resolution is part of the method, and every study states it.
The engine then extracts more from each trading day than a standard midpoint backtest even attempts: full daily OHLC on every underlying, so the day’s true high and low drive every rule that references the underlying’s price; closing bid/ask on every option; and spread-priced fills on every leg, with the realistic and the pure-mid figure printed on every run. Execution modeling — not tick resolution — is where a backtest earns or loses its credibility, and it is where this engine leads.
What it did to our own results
We re-ran all 22 of our published studies under the new model. Twelve changed sign. The pattern is mechanical: the toll is paid per crossing, so the strategies that trade most pay most. In the DTE study, a 7-DTE arm that showed +$9,680 at the midpoint finished at −$7,708 realistic — 1,751 crossings of a SPY spread — while the 60-DTE arm, trading nine times less often, kept a positive number. In the IV-filter study, the filter flipped from a preference to a rescue for the same reason: halving the trade count halves the toll. Single-name spreads (the earnings study) fared worst — their spreads are wider than SPY's, and no population survived.
Publishing numbers that got worse is an unusual marketing decision. We think it is the only defensible one: a backtest's job is to predict what a strategy would have done, and "what it would have done" includes paying the spread. Every result on this site now states both figures, and the gap between them is information, not noise.
Where the model has nothing to price
Honesty about the model includes its boundary. The archive's 2008–2010 files carry closing prices but no bid/ask at all, and 2011 is only 44% quoted. On those days there is no spread to slip against: legs fill at the last traded price, both figures coincide, and the run page counts exactly how many fills did so. The spread-aware boundary of the realistic model is effectively 2012 — runs reaching earlier state their fallback count right on the run page, so the model’s reach is always visible.
What this does not show
These are hypothetical, simulated results on historical end-of-day data. The slip fraction is a model, not a law — your fills depend on order type, size, patience, and the moment you trade, and they land somewhere in the band between the two numbers we print. Closing spreads are also not intraday spreads: quotes at 3:59pm can be wider or tighter than mid-day. What the model guarantees is weaker and more useful: the realistic figure charges something defensible for every crossing, while the optimistic figure shows what pretending execution is free looks like.
Reproducing this
Run any strategy in OptionKrafter — the fill model described here is the engine's default, the slip fraction is adjustable per strategy in the Execution card, and every run page shows the realistic/optimistic pair with the assumptions stamped. The coverage and spread statistics come from the same warehouse every backtest reads.