How often does the wheel actually assign?
Eight years of 0.30-delta weekly cash-secured puts across twelve liquid names: 2,585 put positions, 41 assignments — about 1.6%. The wheel's scariest step is also its rarest, because the exits usually get there first.
Updated Aug 23, 2026 — Re-run under engine rev 3 — figures now include modeled fills. Tables show realistic (slipped fills — the headline) and optimistic (pure mid · reference only). See the methodology. Assignment is a path event, so the counts shift modestly as slipped values move a few exits; the headline rate and every qualitative finding reproduce.
Ask anyone hesitant about the wheel what stops them and the answer is assignment: waking up long 100 shares you didn't exactly choose. Folklore treats it as a routine cost of the strategy. We wanted the actual frequency — across enough names and years to mean something.
Method
- Strategy: the wheel with weekly cash-secured puts at a 0.30 delta target, profit target 50% of credit, stop 200%, run independently on twelve liquid names: AAPL, MSFT, AMZN, NVDA, TSLA, AMD, META, GOOGL, INTC, DIS, KO, XOM.
- Window: January 2018 through December 2025 — eight years containing the 2018 correction, the 2020 crash, and the 2022 bear.
- Counting: a put counts as assigned when it settles in the money and the position converts to shares. Several of these names split during the window (TSLA twice, NVDA, AMZN, GOOGL, AAPL); open positions adjust through splits exactly as the OCC adjusts real contracts — strike divided, contracts multiplied — so split weeks count like any other week (see the methodology).
- Not measured here: P/L. The wheel's economics on high-beta names are dominated by what happens after assignment — a different question, and a different study.
End-of-day by design: like every OptionKrafter backtest, this study runs on daily bars — the resolution that keeps years of history reproducible and matches how rule-based options strategies actually trade — with full daily OHLC on the underlying, spread-priced fills on every leg, and both the realistic and pure-mid figure reported. Run under engine rev 3 (end-of-day). Windows from Apr 2023 now evaluate minute by minute; this study has not been re-run. How the engine models fills →
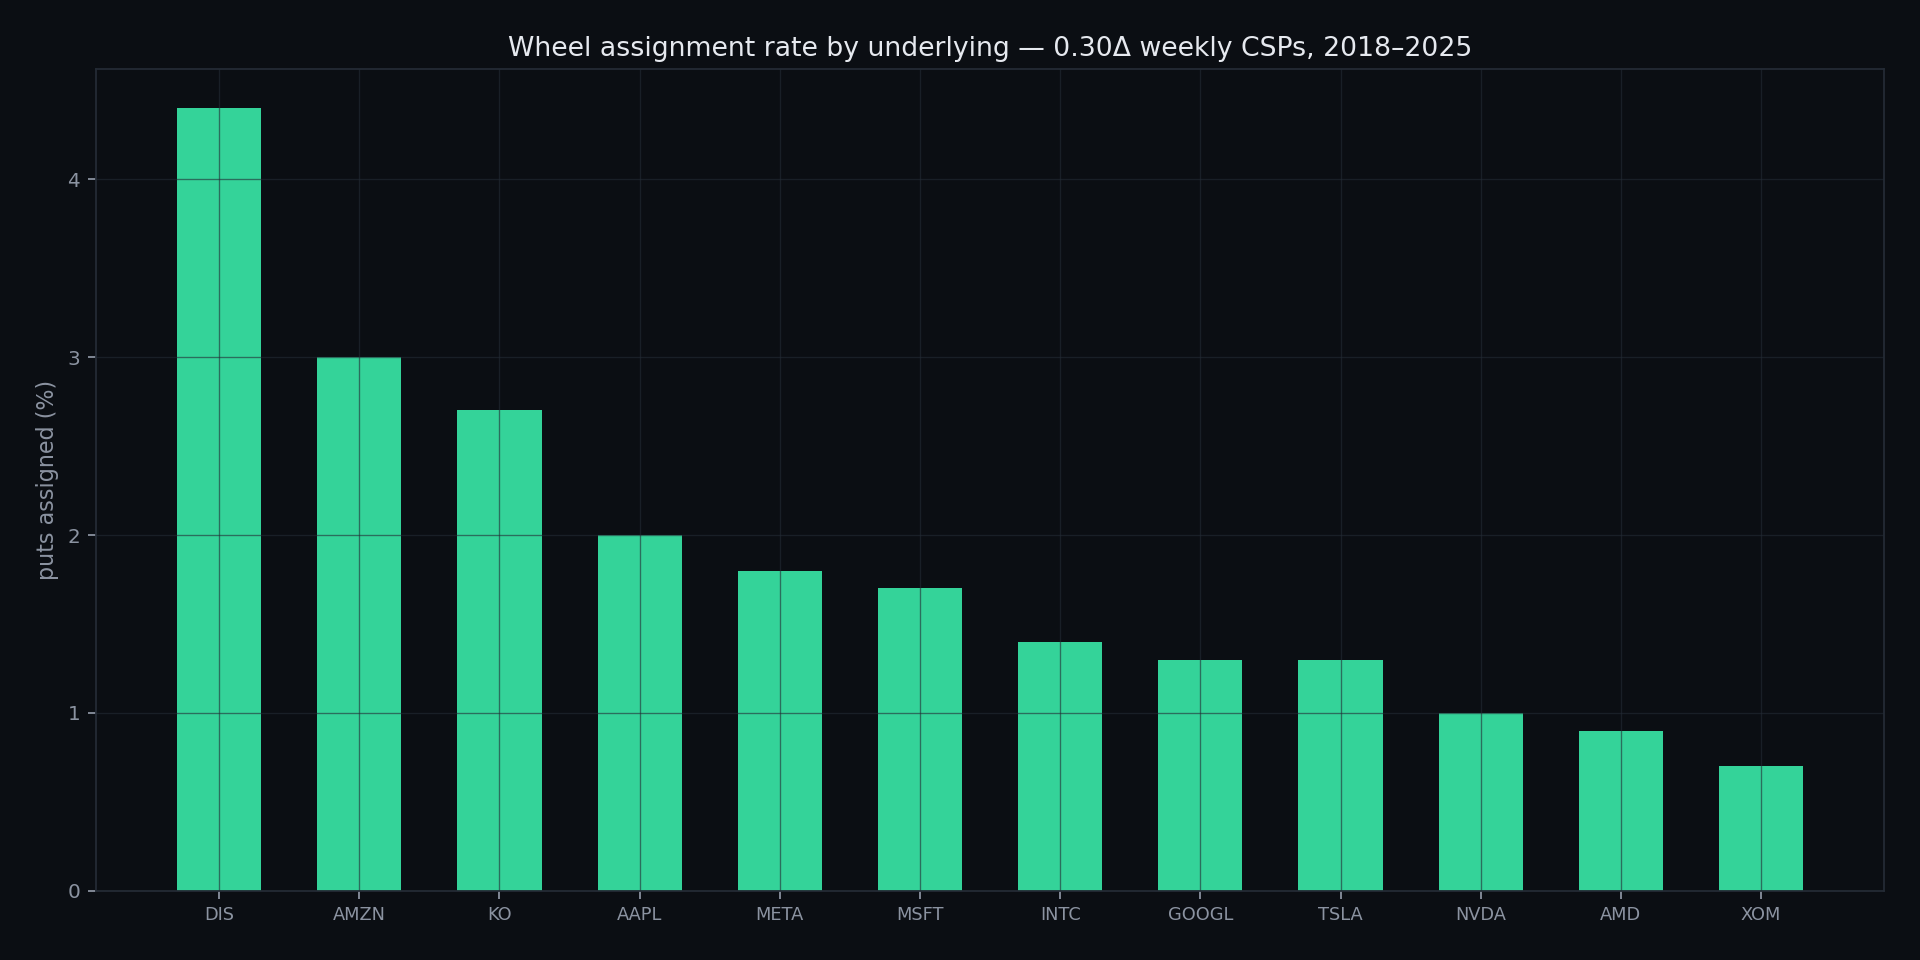
Results
| Underlying | Put positions | Assigned | Rate |
|---|---|---|---|
| DIS | 135 | 6 | 4.4% |
| AMZN | 135 | 4 | 3.0% |
| KO | 185 | 5 | 2.7% |
| AAPL | 196 | 4 | 2.0% |
| META | 110 | 2 | 1.8% |
| MSFT | 119 | 2 | 1.7% |
| INTC | 284 | 4 | 1.4% |
| GOOGL | 154 | 2 | 1.3% |
| TSLA | 312 | 4 | 1.3% |
| NVDA | 315 | 3 | 1.0% |
| AMD | 348 | 3 | 0.9% |
| XOM | 292 | 2 | 0.7% |
2,585 put positions, 41 assignments · realistic fills (0.75 of the spread per leg), no commissions.
Why so rare?
A 0.30-delta put has very roughly a one-in-four chance of finishing in the money — so where did the other twenty-something percent go? The exits got there first. A position that hits its 50% profit target is closed before expiration can assign it; a position moving against you hits the 200% stop and is bought back — still short of expiry. Assignment requires a specific path: a put that goes in the money and stays there through the final bell without first tripping the stop. Across eight years and twelve names, that path occurred about once in every sixty-three positions.
One more counterintuitive cut: positions entered on higher-IV days assigned less often (1.3% for entries above the sample's median IV vs 1.7% below). Richer premium means the profit target sits further from the strike and the stop absorbs more movement — though with only 41 assignments total, treat the direction as an observation, not a law.
What this does not show
These are hypothetical, simulated results on historical data, filled under the engine’s disclosed execution model with no commissions or assignment costs. They are not a record of trading, and past behavior does not indicate future behavior. Twelve mega-cap and blue-chip names over one eight-year window is a benign sample — thinner names gap harder and assign more. The exit rules matter enormously: a wheel run without a stop (a common variant) would be assigned far more often, by design — this study measures one disciplined configuration, not "the wheel" in all its forms. And rarity is not safety: the 2% that assign arrive precisely in the worst markets.
Reproducing this
Create a Wheel strategy on any of the names above: delta mode at 0.30, profit target 50%, stop 200%, window 2018-01-01 through 2025-12-31. The run's trade list marks every assignment; the counts above are those records.