The 0DTE iron condor: a 75% win rate that still loses money
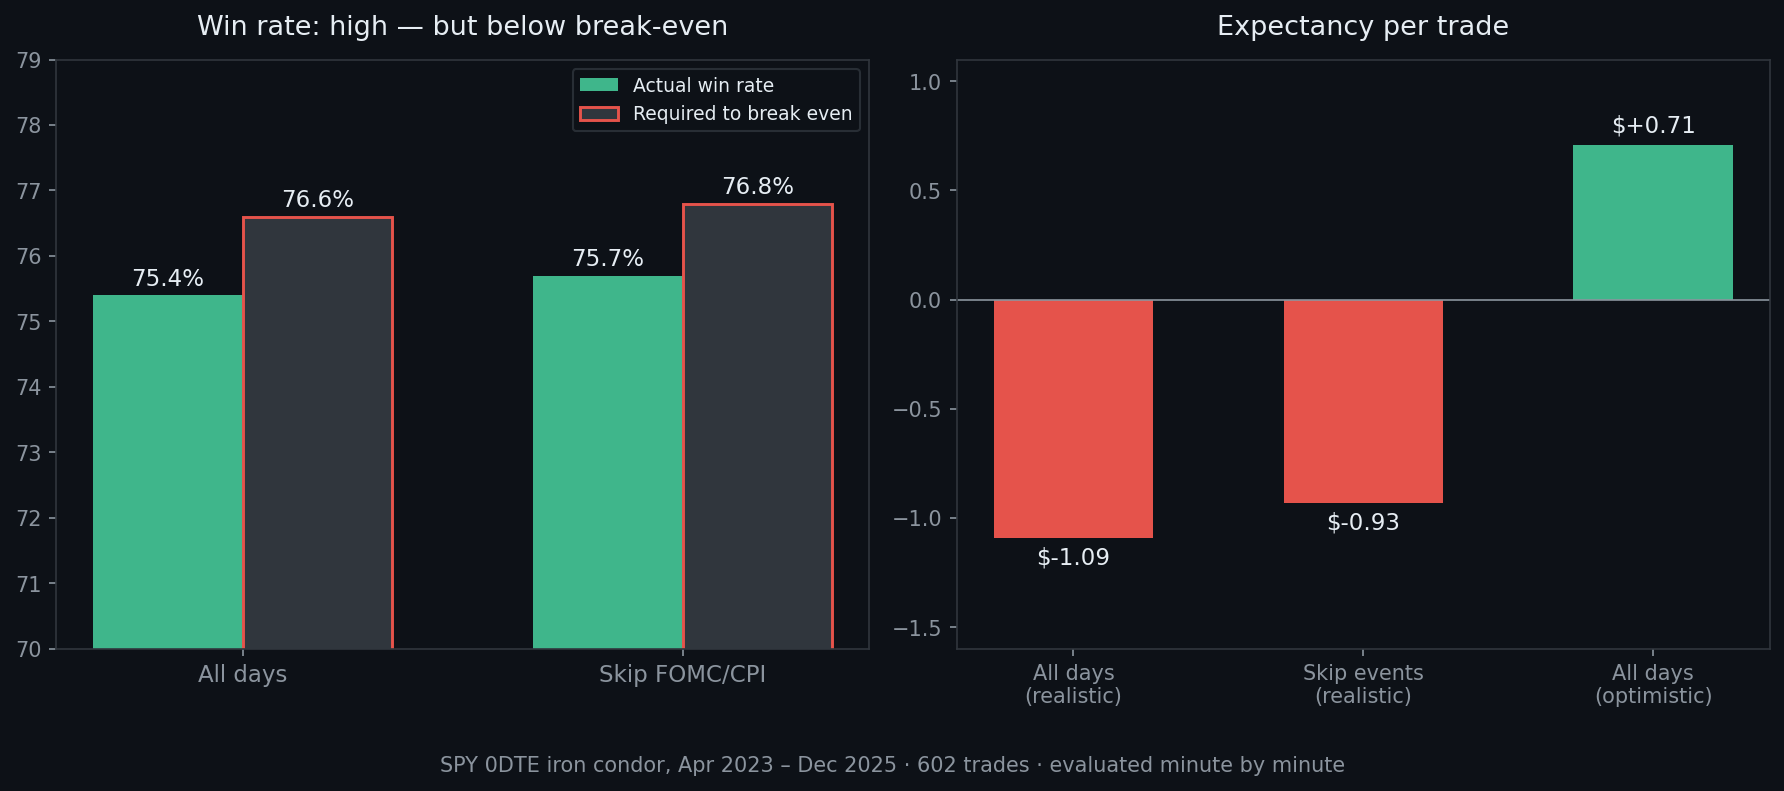
We ran the classic same-day SPY iron condor — 16-delta shorts, $5 wings, 10:00 ET entry — through every trading day from April 2023 to December 2025, minute by minute. It won three trades out of four and still lost money: the strategy needs a 76.6% win rate to break even and delivered 75.4%. At optimistic (pure mid) fills the same trades are profitable — the whole edge dies in the fills.
Same-day iron condors on SPY win three trades out of four. We ran every trading day for two and three-quarter years, minute by minute, through historical option data to ask the question that the win rate doesn't answer: does it make money?
It doesn't — and the reason is the most useful part.
The strategy we tested
The most commonly described 0DTE income setup, mechanized exactly:
- SPY iron condor, same-day expiration (strict: if today's expiry isn't listed, no trade)
- Entry at 10:00 ET — after the opening auction settles, never before
- Short strikes near 16 delta on each side, $5 wings
- Skip the day if total credit is under $0.20
- Exit: 50% of credit profit target, 2× credit stop, or buy everything back at 15:45 ET — no position ever rides into the close
- $0 commission, so the results isolate market friction from broker friction
- Window: April 3, 2023 → December 31, 2025 — every day evaluated minute by minute on historical option trade prints, entries and exits filled with our disclosed fill model, with the optimistic (pure mid) figure reported alongside
Two variants: A trades every eligible day (602 trades); B also skips the 53 days with an FOMC decision or a CPI release (556 trades — using actual release dates, including the shutdown-shifted late-2025 CPI schedule).
Results
| A — all days | B — skip FOMC/CPI | |
|---|---|---|
| Trades | 602 | 556 |
| Win rate | 75.4% | 75.7% |
| Required win rate to break even | 76.6% | 76.8% |
| Average win | +$20.90 | +$20.20 |
| Average loss | −$68.52 | −$66.82 |
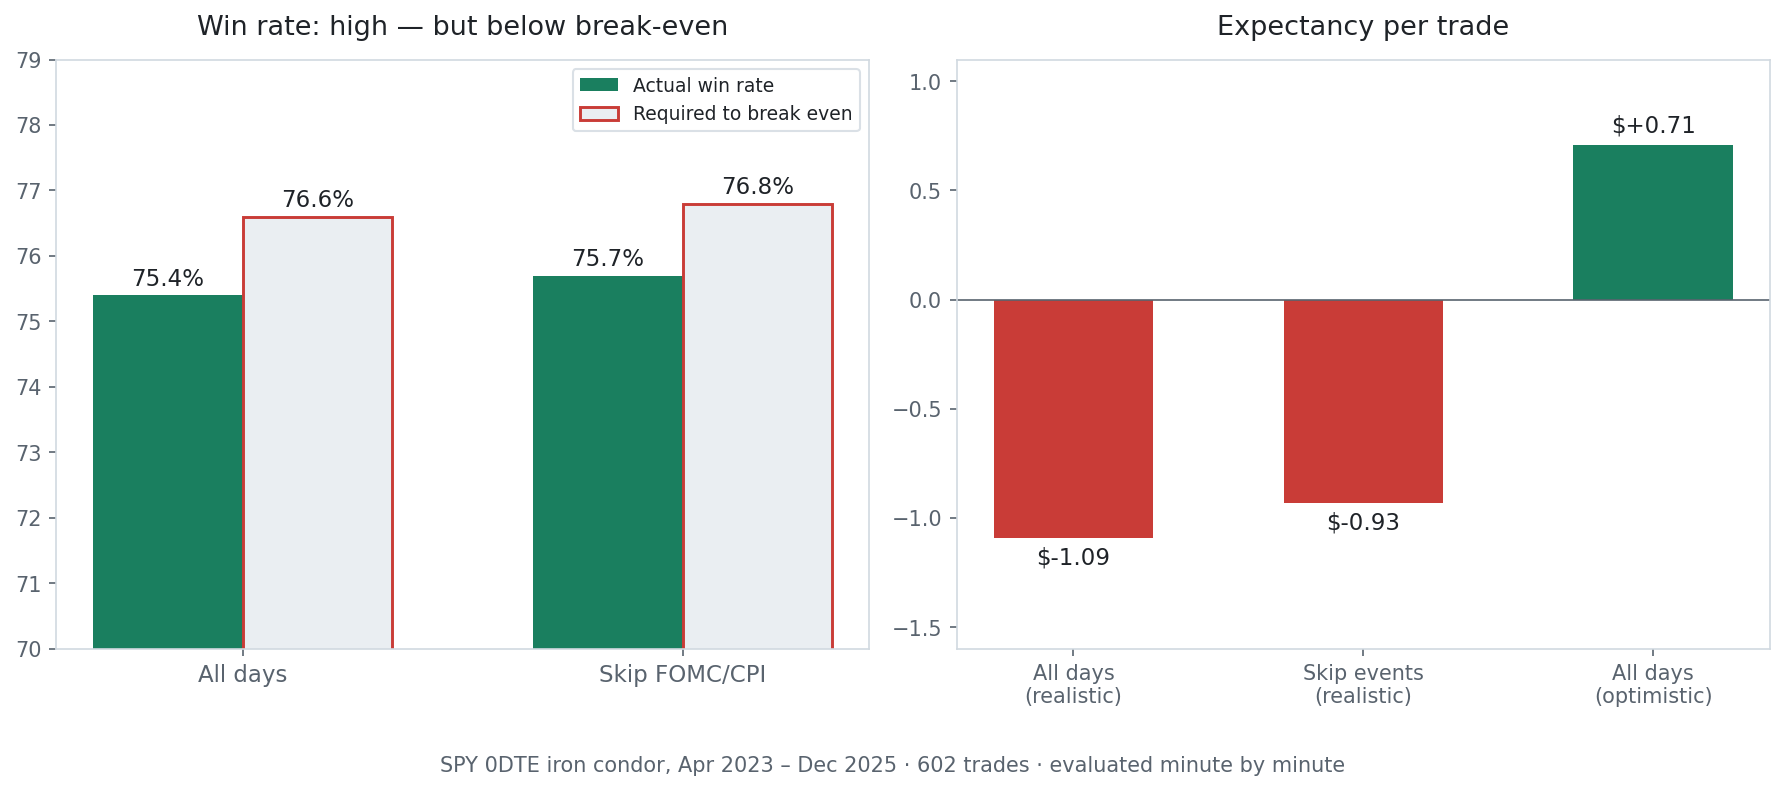
| Expectancy per trade | −$1.09 | −$0.93 |
| Net P/L (realistic) | −$655 | −$517 |
| Net P/L (optimistic — pure mid) | +$427 | +$463 |
| Max drawdown | −$2,593 | −$2,547 |
| Exits | 442 PT · 130 stop · 28 flat · 2 expired | 410 PT · 120 stop · 24 flat · 2 expired |
One contract per trade, one position at a time · average credit collected ≈ $51 per condor against $500-wide wings.
Run under engine rev 4 (minute by minute), the revision current at publication; this study has not been re-run under later revisions.
The math the win rate hides
A 75% win rate sounds like an edge. It isn't one — it's one side of a ratio. With average wins of $21 and average losses of $69, the break-even win rate is
required win rate = 68.52 ÷ (20.90 + 68.52) = 76.6%
The strategy delivers 75.4%. That 1.2-point shortfall, spread over 602 trades, is the entire −$655. Selling a 16Δ condor should win roughly three times in four — the market prices that in. Winning often is the product design, not the profit.
Where the edge actually went: the fills
The same 602 trades, marked at the optimistic figure, net +$427. With realistic fills they net −$655. The difference — about $1.80 per trade across eight leg-fills — is the bid/ask cost of trading four-legged spreads twice a day in options that expire in hours.
That is the finding. The 0DTE condor's theoretical edge is smaller than its friction. Any backtest of this strategy that fills every leg at mid will tell you it works; the minute-by-minute prints say the midpoint was rarely yours to have.
Do event days matter?
Yes, but less than the folklore says. The 46 trades entered on FOMC or CPI days ran a −$3.00 per-trade expectancy at a 71.7% win rate — roughly three times worse than ordinary days (−$0.93). Skipping them (variant B) recovers $138 of the loss and does not flip the sign. Event days hurt; they are not the reason the strategy loses.
Path, not just endpoint
The loss is not evenly spread: 2023 finished +$401 and 2025 +$543, while 2024 took −$1,599 — much of it in the early-August volatility unwind. Two scratch years and one bad stretch is what a sub-break-even win-rate strategy looks like from inside: long pleasant streaks, occasional clusters of $70 losses, and a max drawdown five times the average monthly P/L.
Honest limits
- This is SPY, not SPX. SPY 0DTE condors are the retail-sized, American-style, physically-settled sibling of the SPX cash-settled trade. Directionally informative for SPX; not identical.
- About 88 trading days produced no trade, mostly because the $0.20 minimum credit wasn't there at 10:00 ET.
- Commissions are $0 by design. Add per-contract fees and every number gets worse by 8 × your rate per trade.
- One fill model, disclosed, applied uniformly (how fills are modeled).
The same engine you can use
Every number here comes from the same backtest engine, fill model, and historical option data that run every OptionKrafter backtest — this study is a strategy configuration, not custom research code. Strike selection by delta, profit targets, stops and minimum-credit filters are all standard settings in the app, on every plan including Free, as is the 10:00 ET entry used here.